The following steps show how to utilize the NSX Dashboard for monitoring:
- From the vSphere Web Client, navigate to Home | Networking & Security| Dashboard:

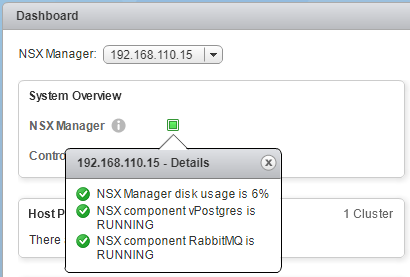
- The System Overview section has the subsections NSX Manager and Controller Nodes. You can click on the icon beside NSX Manager to see the component status and disk usage of NSX Manager:
- The icon next to Controller Nodes will show each of the controller node statuses (running/disconnected/powered off), the peer connectivity to other controller nodes, and the connectivity ...

