In NSX 6.4, the NSX dashboard is available both in vSphere Web Client and the HTML5-based vSphere Client. The NSX 6.4 dashboard introduces additional widgets and customizable custom widgets that can be created through REST APIs:
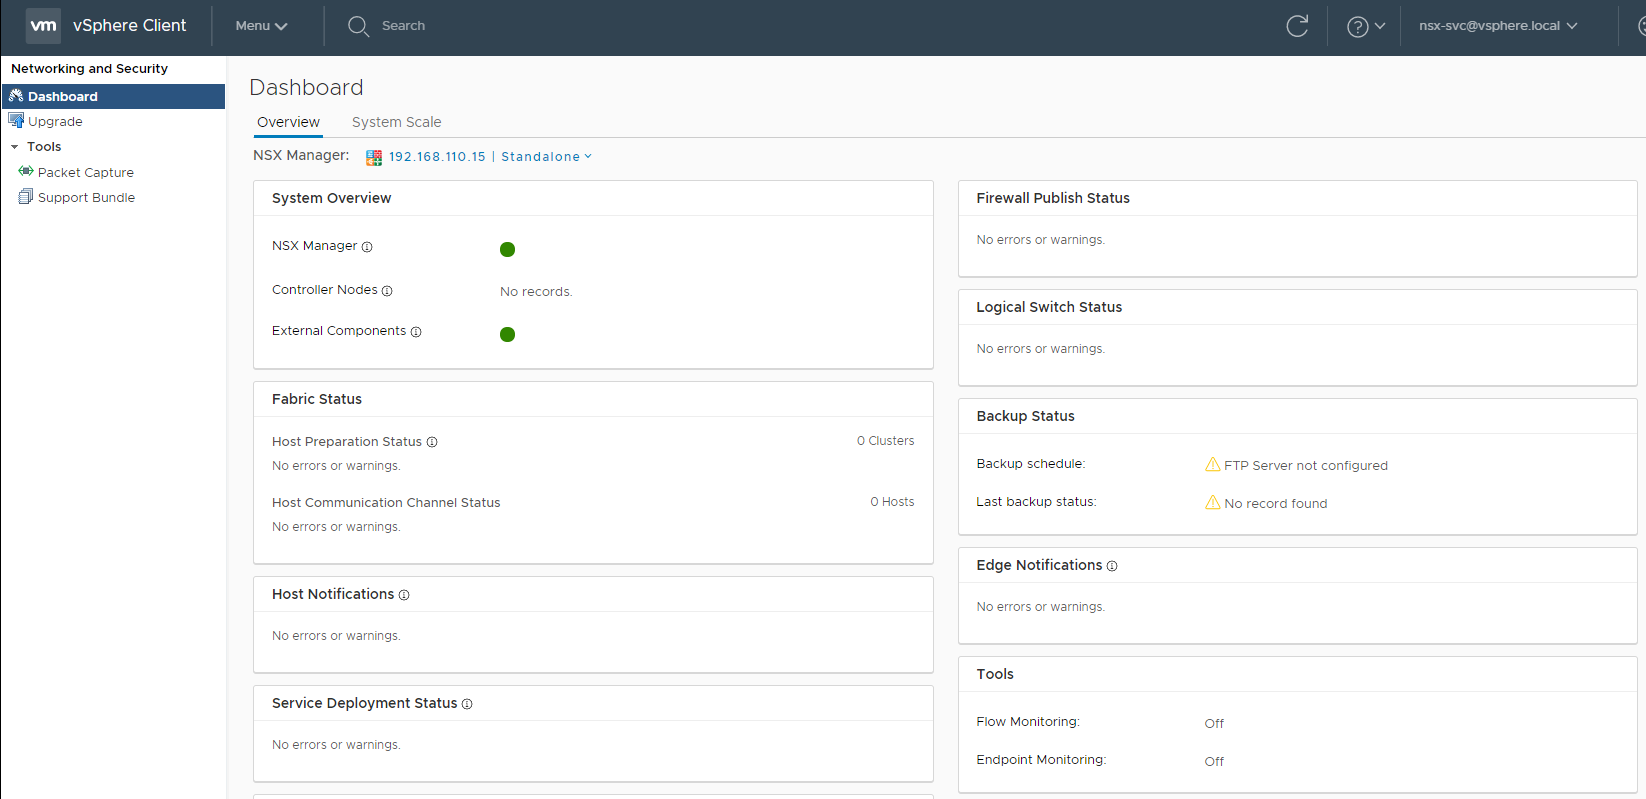
There is also a new tab in the dashboard that provides visibility into the current system's scale capacity and configuration maximums for various NSX object types. This provides visibility on the current system's capacity relative to recommended NSX configuration maximums. By default, the usage warning threshold is 80%, and is configurable through the REST API:

