What to Look For
Okay, stories. Check. Now what kind of stories do you tell with data? Well, the specifics vary by dataset, but generally speaking, you should always be on the lookout for these two things whatever your graphic is for: patterns and relationships.
Patterns
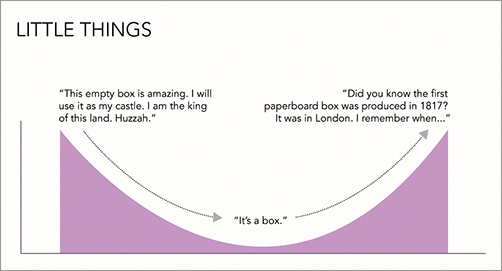
Stuff changes as time goes by. You get older, your hair grays, and your sight starts to get kind of fuzzy (Figure 1-5). Prices change. Logos change. Businesses are born. Businesses die. Sometimes these changes are sudden and without warning. Other times the change happens so slowly you don’t even notice.
Figure 1-5: A comic look at aging
Whatever it is you’re looking at, the change itself can be interesting as can the changing process. It is here you can explore patterns over time. For example, say you looked at stock prices over time. They of course increase and decrease, but by how much do they change per day? Per week? Per month? Are there periods when the stock went up more than usual? If so, why did it go up? Were there any specific events that triggered the change?
As you can see, when you start with a single question as a starting point, it can lead you to additional questions. This isn’t just for time series data, but with all types of data. Try to approach your data in a more exploratory fashion, and you’ll most likely end up with more interesting answers.
You can split your time series data in different ...
Get Visualize This: The FlowingData Guide to Design, Visualization, and Statistics now with the O’Reilly learning platform.
O’Reilly members experience books, live events, courses curated by job role, and more from O’Reilly and nearly 200 top publishers.

