Energy Industry Visual Solutions
- Dynamically Displaying Spare Parts Status
- Green Energy Startup Showcases Approach and Savings with Infographic
- Dynamically Displaying the Control Room in 3D
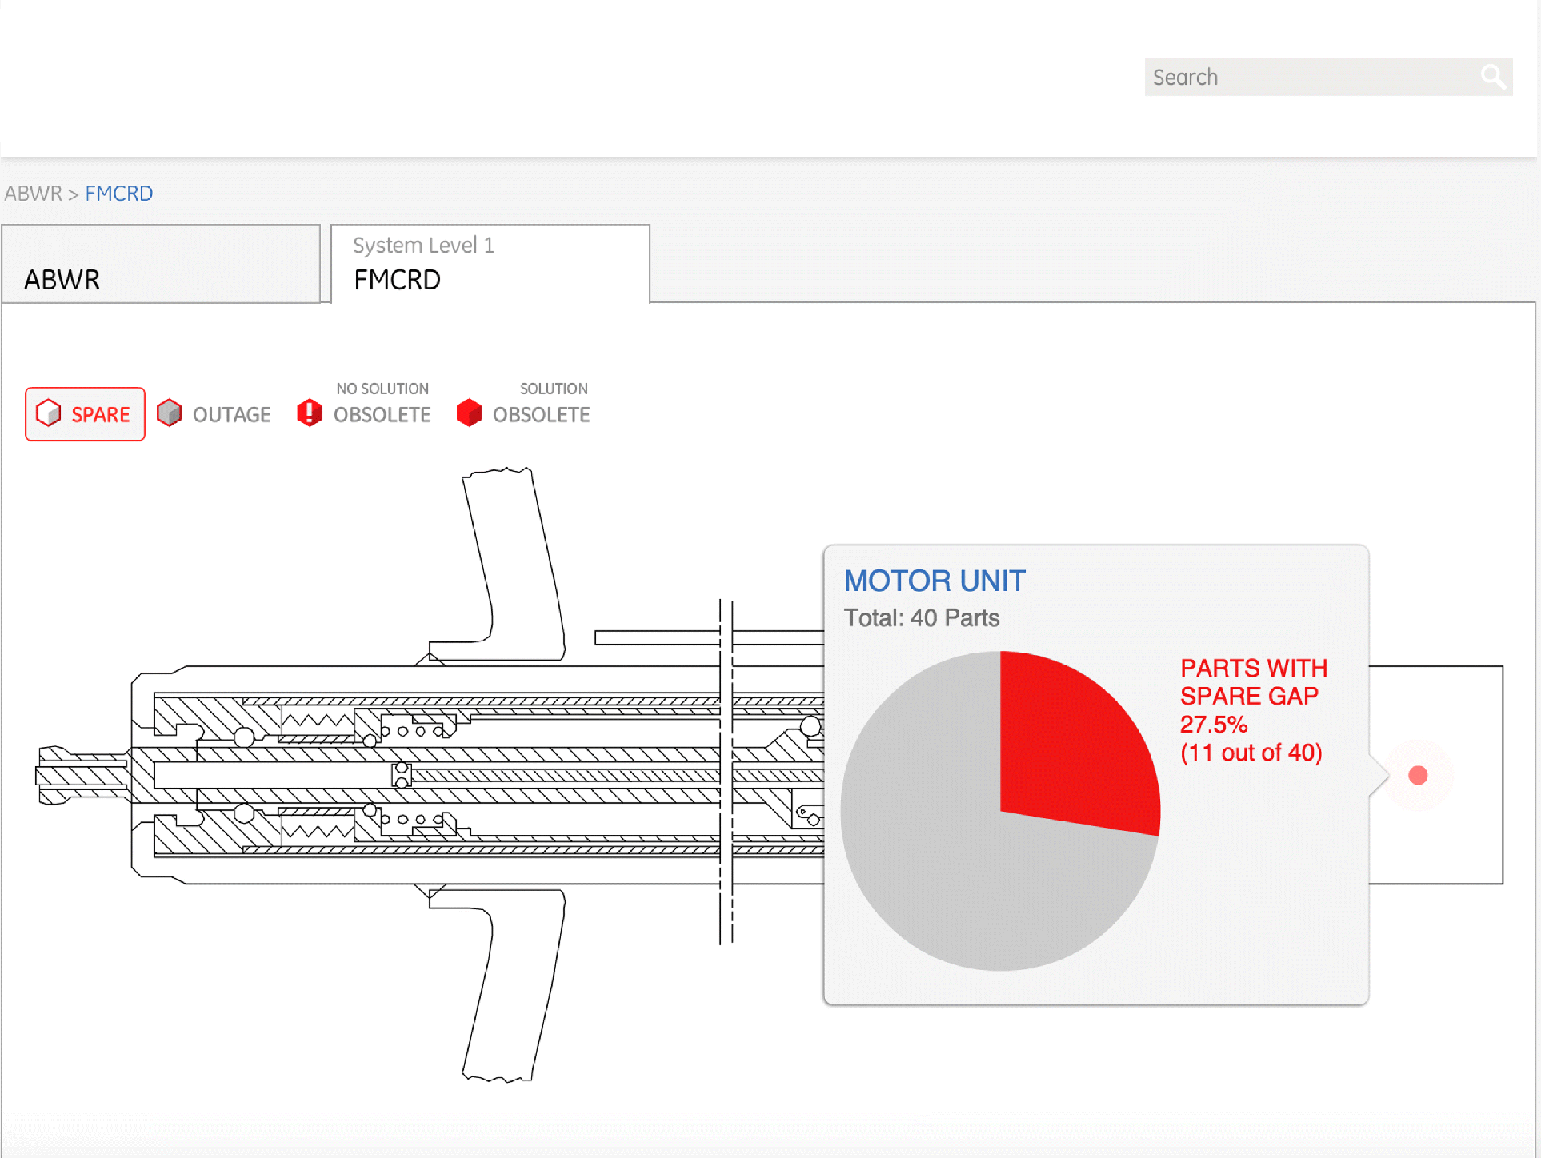
Dynamically Displaying Spare Parts Status
While construction of new nuclear reactors has slowed down, the management and supply of spare parts for legacy reactors is a fertile business. To enable its clients to quickly see what parts need to be ordered, we created a dynamic data-fed visualization of quantity and obsolescence status of spare parts. Instead of poring through reams and reams of spreadsheets, red pulsating spots dynamically displayed where their clients need to focus their attention.

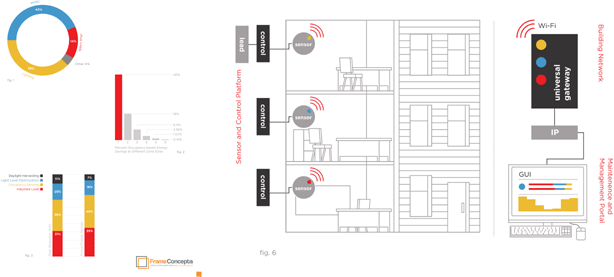
Green Energy Startup Showcases Approach and Savings with Infographic
A California-based green energy startup developed technology and an approach that delivered the most energy savings with the largest energy category for large office buildings'lighting. This infographic shows how the sensors coupled to computing programs delivered the solution, while a colorful dynamic visualization showcased the actual savings.

Dynamically Displaying the Control Room in 3D
We had already provided the prototype for the dynamic visualization of spare parts status within the nuclear reactor; now the project ...
Get Visual Content Marketing now with the O’Reilly learning platform.
O’Reilly members experience books, live events, courses curated by job role, and more from O’Reilly and nearly 200 top publishers.

