Data-Driven Visualizations and Applications
- Nuclear Spare Parts Division Needs to Visually Cause Their Clients to Order Spare Parts
- An Accounting Association Celebrates 125-Year History with Tablet Data-Driven Visual Timeline
- Healthcare Managed Service Provider Trains Its Stakeholders the Best Service Delivery Framework with Visual Interactive Card Training Game
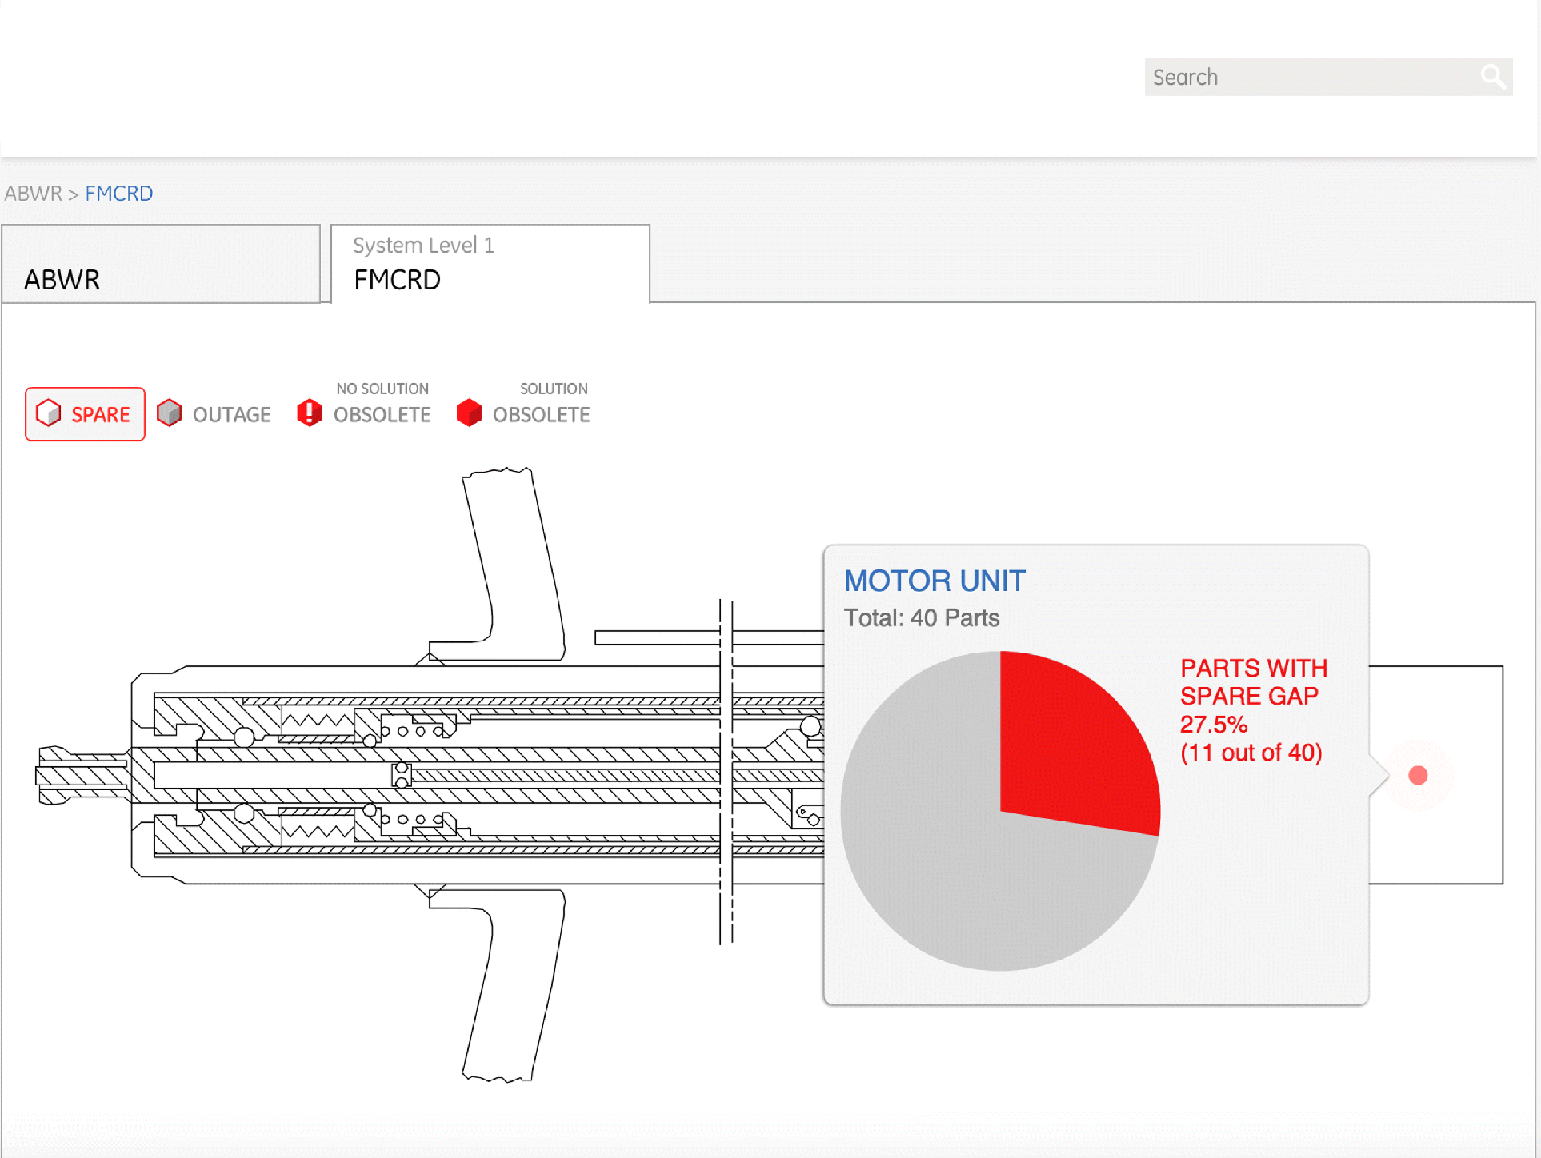
Nuclear Spare Parts Division Needs to Visually Cause Their Clients to Order Spare Parts
There are not a lot of new nuclear reactors being built, but there are legacy reactors that require spare parts to be stocked and replacement parts for obsolete items to be engineered. However, the nuclear reactor clients were forced to go through reams and reams of spreadsheets to determine what the status of each part actually was. In this project, a prototype was developed to visualize spare parts status for both the nuclear reactor and the control room. The key was a red pulsating point that dynamically allowed the client to navigate quickly to the spare part concern and see a visual of the actual part in question and what its status was. Once the client's client was onboard with the approach, then a full stack data-driven and browser-compatible data visualization application was both designed and developed. But the key driver at the ideation stage was the pulsating point.

An Accounting Association Celebrates 125-Year ...
Get Visual Content Marketing now with the O’Reilly learning platform.
O’Reilly members experience books, live events, courses curated by job role, and more from O’Reilly and nearly 200 top publishers.

