Infographics
- Financial Data Innovation Lab Wants to Visually Showcase Innovation Output
- Large Digital Media Company Needs to Shake Up Advertisers During Ad Week with Ecommerce Metrics
- Predictive Analytics Firm Uses Infographic to Debrief Analysts
Financial Data Innovation Lab Wants to Visually Showcase Innovation Output
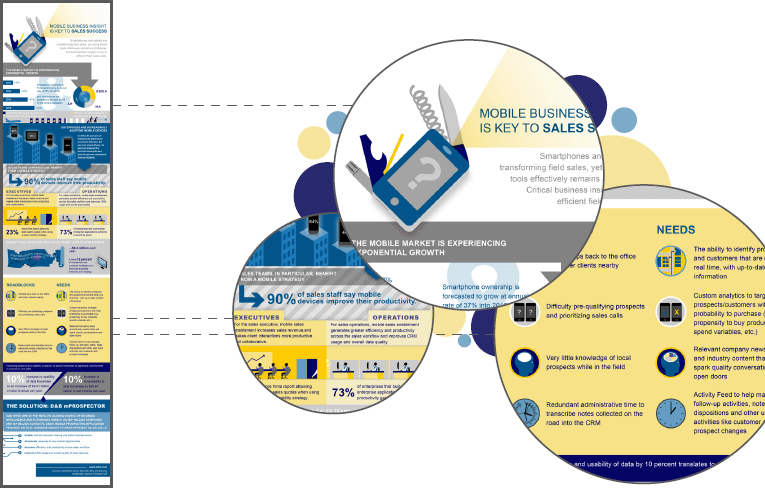
An Enterprise Innovation Lab based in New York wanted to showcase how their comprehensive databases of financial information focused in the SMB space could integrate with innovative technology startups to produce impactful marketplace-specific solutions. One of the first innovative integrated solutions spun out of the lab was mProspector'a mobile solution that enabled field sales representatives to walk into any building or down any city street and tell what businesses existed in that building and neighborhood, know key pertinent financial data and staff at that office, and capture any additional information from that visit and load it into the company's CRM tool, all while traveling and using only their smartphones. To tease out the innovation and value inherent in the solution, the client asked to have it visually packaged into the form of a one-page infographic.
Large Digital Media Company Needs to Shake Up Advertisers During Ad Week with Ecommerce Metrics
The newly developed digital properties within a relatively new digital division needed to communicate ...
Get Visual Content Marketing now with the O’Reilly learning platform.
O’Reilly members experience books, live events, courses curated by job role, and more from O’Reilly and nearly 200 top publishers.

