CHAPTER 9
The 1.8 Standard Deviation Solution
If an investor goes to an investment counselor, most likely he will be given advice that echoes what was discussed in the previous chapter: “Investing for the long term requires patience, a diversified portfolio, and more of a ‘buy and hold' approach over an investment horizon.” This advice, while sound and certainly rational based on modern portfolio theory, has been under attack over the last decade. There are obvious grounds for that concern. Let's look at some numbers. Figure 9.1 is a chart of the annual capital appreciation plus dividend yield for the Dow Jones Industrial Average (DJIA) from 1929 to 2011.
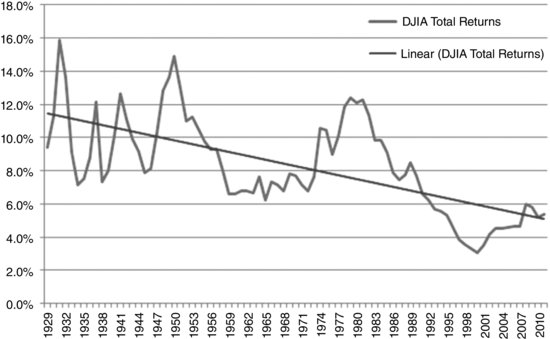
Assuming the data are correct, the trend line indicates that the DJIA annual return has been declining from about 11 percent in the 1930s to approximately 9 percent in the 1960s to about 6 percent in the first decade of the 2000s. Will it now reverse and go back up to 9 percent? Clearly, this is unpredictable and can only be estimated with probabilistic assumptions. Returns may spike to 9 percent or greater, stay at 6 to 7 percent, or even drift lower depending on any number of events.
What about the S&P 500? In Chapter 8, it was stated that the long-term market return was about 10 percent annually. If an investor had invested $1,000 into the S&P ...
Get Vertical Option Spreads: A Study of the 1.8 Standard Deviation Inflection Point, + Website now with the O’Reilly learning platform.
O’Reilly members experience books, live events, courses curated by job role, and more from O’Reilly and nearly 200 top publishers.

