Chapter 29
Producing Lower Fat-Tailed Risk with Higher Returns
For the statistically inclined, this chapter continues the discussion from Chapter 28, “How Risk Modeling for Stock Selection Has Evolved” and excerpts two key sections from Chapter 9, “Lower Risk and Higher Returns: Linking Stable Paretian Distributions and Discounted Cash Flow,” from Wiley's Valuation Handbook.1
Based on the data, LifeCycle's system computed the statistics in Table 29.1 for the four stable Paretian parameters. All four parameters confirm the non-normality of the data. The peakedness of the data is obvious from the alpha parameter. The data also are negatively skewed and more dispersed than the normal distribution would imply. Statistically, each and every parameter is significantly different from the normal distribution parameters. These statistical results effectively refute Paul Cootner's2 constructive criticism of Mandelbrot's research as “too casual.”
Table 29.1 Stable Paretian Parameters of Stock Returns
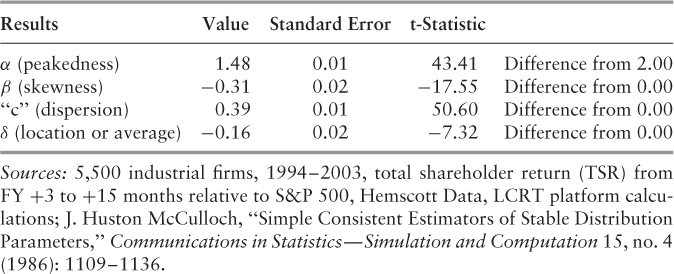
As described by J. Huston McCulloch, the following parameters characterize a stable Paretian distribution:
- α, which determines the peakedness and thickness of the tails, falls in the range 0 ≤ α ≤ 2, where 2 is the limiting case of the normal distribution.
- β determines the skewness.
- “c” determines the scale (dispersion).
- δ determines the location.
For the limiting normal case, α is 2 and β ...
Get ValuFocus Investing: A Cash-Loving Contrarian Way to Invest in Stocks now with the O’Reilly learning platform.
O’Reilly members experience books, live events, courses curated by job role, and more from O’Reilly and nearly 200 top publishers.

