THE MODEL AND MARKET EXPECTATIONS
The new model can be used to quantify growth patterns consistent with a firm’s stock price. This section addresses how the implied growth responds to changes in three of the variables: the P/E (P0/E1), the reinvestment rate, and the discount rate. The calculations use Equation 8.10, which rearranges Equation 8.8 (or Equation 8.4) to show how τ can be calculated given specific values of ρt = 0, Et = 1,and k:
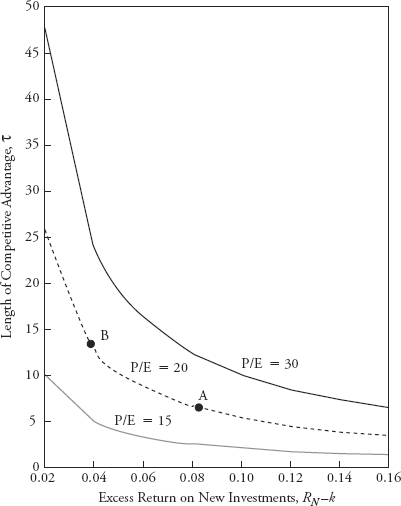
Figure 8.1 uses Equation 8.10 to plot growth patterns consistent with three P/Es—P/E = 15, 20, and 30—assuming that the firm does not pay dividends. The growth patterns are defined by (1) length of the period of competitive advantage, τ, and (2) the excess investment return, RN − k. Because Figure 8.1 considers a non-dividend-paying stock, θ was defined by Equation 8.5. In each case, k was assumed to be 8 percent. As noted previously, the model ignores earnings growth caused by inflation and does not include an inflation premium in the discount rate. This assumption implies that the value effect of any earnings growth caused by inflation will exactly offset the value effect of an inflation premium in the discount rate.3
FIGURE 8.1 Growth Patterns Consistent with P/Es of 15, 20, and 30 when k = 8 Percent and ρ = 100 Percent
Get Valuation Techniques: Discounted Cash Flow, Earnings Quality, Measures of Value Added, and Real Options now with the O’Reilly learning platform.
O’Reilly members experience books, live events, courses curated by job role, and more from O’Reilly and nearly 200 top publishers.

