PRIOR U.S. EVIDENCE: DOMINANCE OF EARNINGS
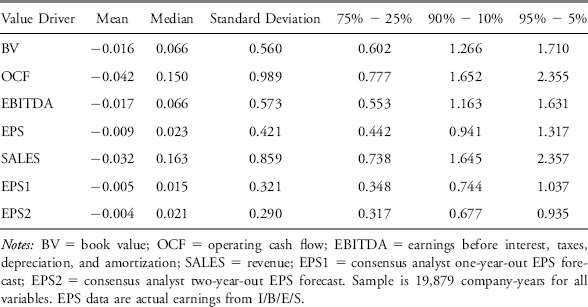
In Liu et al. (2002), we examined the pricing performance of a large set of multiples applied to a sample of 19,879 U.S. company-year observations for the 1982–1999 period. Table 19.1 presents statistics from the distributions of the price-deflated valuation errors of selected industry multiples: book value (BV), operating cash flow (OCF), earnings before interest, taxes, depreciation, and amortization (EBITDA), EPS, revenue (SALES), and consensus analyst one-year-out and two-year-out EPS forecasts (EPS1 and EPS2).
TABLE 19.1 Distribution of Price-Deflated Valuation Errors from U.S. Industry Multiples, 1982–1999
Source: From Panel A of Table 19.2 in Liu et al. (2002).

Examination of the standard deviation and three nonparametric dispersion measures (interquartile range, or 75th percentile less 25th percentile, 90th percentile less 10th percentile, and 95th percentile less 5th percentile) suggests the following ranking of multiples. Forecast earnings perform best; they exhibit the lowest dispersion of pricing errors. This result is intuitively appealing because earnings forecasts should reflect future profitability better than historical measures do. Consistent with this reasoning, performance improves with forecast horizon: The dispersion measures for two-year-out forward earnings (EPS2) are lower than those for one-year-out earnings (EPS1). ...
Get Valuation Techniques: Discounted Cash Flow, Earnings Quality, Measures of Value Added, and Real Options now with the O’Reilly learning platform.
O’Reilly members experience books, live events, courses curated by job role, and more from O’Reilly and nearly 200 top publishers.

