IMPACT OF EARNINGS SURPRISES
As is widely known, stock prices do indeed respond to earnings surprises, as shown in Figure 18.1. Quarterly abnormal returns are plotted on the vertical axis as a function of quarterly forecast error (realized earnings versus the I/B/E/S consensus forecast adjusted by the stock price) for a large sample of companies. The result is an S-shaped nonlinear curve. For high-growth stocks, a 1 percent earnings surprise as a percentage of price triggers a 12 percent increase on the upside and a 15 percent decrease on the downside. If one could perfectly forecast these earnings surprises, one could generate a 27 percent quarterly hedge portfolio return. Earnings quality analysis is powerful because it is very good at forecasting these earnings surprises.
FIGURE 18.1 Earnings Surprise Response Functions for High-Growth and Low-Growth Stocks: Quarterly Abnormal Returns vs. Quarterly Forecast Error
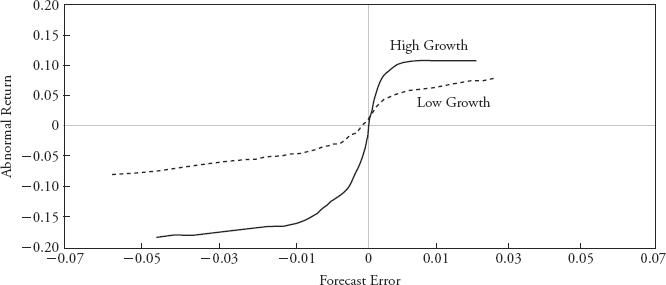
I would like to emphasize the asymmetric nature of this graph for high-growth stocks. Earnings quality analysis is most useful in picking “earnings torpedoes” in growth stocks (i.e., growth stocks that are trading at high valuations but are doing it through the use of aggressive accounting). These valuations get addictive to the managers of these companies. They are great when managers are raising capital. They are also great when managers have stock options in the ...
Get Valuation Techniques: Discounted Cash Flow, Earnings Quality, Measures of Value Added, and Real Options now with the O’Reilly learning platform.
O’Reilly members experience books, live events, courses curated by job role, and more from O’Reilly and nearly 200 top publishers.

