FCF EXAMPLE
An example can help illustrate the simple yet comprehensive nature of FCF analysis. Table 16.1 is from Colgate-Palmolive Company’s December 31, 1996, annual report. The focus here is entirely on Steps 1, 2, and 3, which are reasonably objective in nature and thus generalizable. Steps 4 and 5 would require more subjective judgments on the part of the individual analyst performing the analysis. (For this particular company, it also turns out that Step 4 is unnecessary because the leverage is immaterial.)
TABLE 16.1 Colgate-Palmolive Financial Statement Data, December 31, 1996 ($ millions except as noted)
Source: Based on data from Colgate-Palmolive Company 1996 annual report.
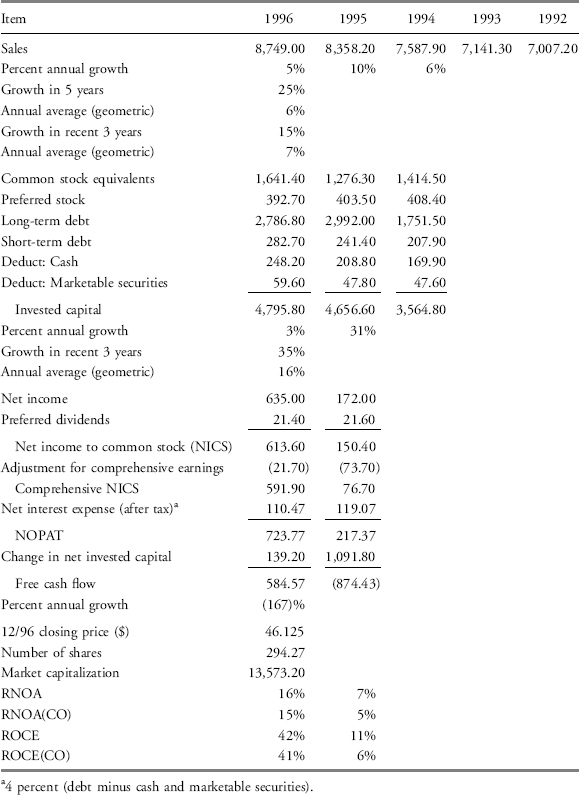
- Step 1. NOPAT for 1996 is calculated as $723.77 million, starting with net income and adjusting for foreign currency earnings and financial items. The invested capital is the sum of the book values of equity, preferred stock, long-term debt, and short-term debt less cash and marketable securities. The change in invested capital from 1995 to 1996 was $139.20 million. 1996 FCF was, therefore, $584.57 million ($723.77 million − $139.20 million).
- Step 2. In 1996, sales were $8,749.00 million; the five-year average growth trend in sales has been 6 percent; and the three-year trend has been 7 percent. A reasonable range for growth in sales, therefore, is 5 to 8 percent. This range also corresponds, at ...
Get Valuation Techniques: Discounted Cash Flow, Earnings Quality, Measures of Value Added, and Real Options now with the O’Reilly learning platform.
O’Reilly members experience books, live events, courses curated by job role, and more from O’Reilly and nearly 200 top publishers.

