Chapter 4. Conducting Competitive Research
You were right. I was on the wrong track.
Weâre deep in the valley, how deep in the gulley.
And now in the canyon. Out in the yonder.
âSONIC YOUTH (1984)
NOW THAT YOU HAVE A STRONG POSITIVE SIGNAL THAT YOUâRE ONTO something, you need to ask, âWhy hasnât this solution been built yet?â I hesitate to say that everything has been done, but pretty much everything has been attempted. Itâs because individuals and companies have been designing products for distribution and consumption on the Internet for more than 20 years! Knowing what has actually worked or failed is crucial to identifying a competitive advantage. So, in this chapter and the next, we will look more deeply into Tenet 1, Business Strategy (Figure 4-1).

Learning Lessons, the Hard Way
Doing solid investigative market research is like peeling an onion. The more layers you peel, the more you reveal. And it also might bring tears to your eyes if you discover that your product vision is not actually unique. But donât you want to know what it will take to beat the competition sooner rather than later? If you donât know what you donât know, you are at risk of learning the hard way.
Take, for instance, my dear father. In 1976, at the age of 38, he got up the courage to quit his full-time job as the area management supervisor for a popular California restaurant chain. Heâd been working for others since he graduated from UCLA with an accounting degree and was eager to be an entrepreneur. His good friend did well for himself by opening several hot dog stands in the Los Angeles area. So, my father was confident that his own management experience would bring him success.
He soon found a hot dog stand for sale next to a carwash in North Hollywood. He watched the operation briefly and saw how very few customers came to the stand even while their cars were being washed. The place was run down, and the owner appeared indifferent to his customers. My father saw an opportunity for turning the stand into a profitable business and bought it immediately.
Figure 4-2 shows how he gave everything a fresh coat of paint, updated the menu, and put up a big sign that said the stand was under ânew management.â

On opening day, though, he sold fewer than 10 hot dogs. Worse, cockroaches crept across the serving counter, and my dad kept trying to squash them before customers walked up. At the time, my brother and I (then 10 and 12) would hang out at the stand on the weekends, and we could see that my dad didnât know what to make of his new business. Eventually, he realized that in spite of all his efforts, he couldnât turn it around. His management expertise did not translate into the emotional stamina and physical strength required to perform the daily operations of the business. So he put it up for sale.
One morning someone responded to his âHot Dog Stand For Saleâ ad. The man showed up to the stand at noon and introduced himself. He bought a hot dog and then sat down at a table to observe the entire lunch shift. In the first hour, an elderly woman who lived at the nearby senior-citizen home walked up and bought a hot dog. After one bite, she asked for her money back. She said, âIt didnât taste right.â
The man came back the next day and watched another lunch shift. Before he left, my father asked him what he thought of the business.
âTo be honest, Alan,â the man replied with a heavy Armenian accent, âYou are married to a corpse.â
That comment depressed my father for days. He decided to accept his fate and sold the stand at a significant loss, which was truly tough for my family. But the whole experience taught my father (and us kids) lessons that were huge.
Using the Competitive Analysis Matrix Tool
You and your team might think you are creating a new marketplace with your product, but how can you be sure? Chances are you actually are entering an existing market. Therefore, you want to study how all the current digital solutions address the needs of your target customers.
To be competitive, you need to know whatâs out there, what has worked, and what has not worked. Thatâs why conducting market research on the competition is a crucial component of business strategy. You want firsthand knowledge of the good and bad user experiences provided by your competitors. If done thoroughly, the research can provide a treasure trove of insight into current trends and outdated manifestations of mental models. It will also help your team learn about the competitors, their best practices for design, and what types of customer segments use their products. To connect the dots, though, you first need to collect them.
I have found the most efficient way to do a comprehensive competitive analysis is to collect all of the data in a matrix. Itâs the most obvious way to do a cross-comparison, and by using a spreadsheet, I can methodically collect data and not miss anything while Iâm surfing around to research. The matrix helps keep track of everything that needs to be compared. When itâs complete, I can rationalize my position with a cogent understanding of numerous qualitative and quantitative data points.
I use Google spreadsheets instead of Excel because I prefer a free cloud-based tool that is easily accessible to as many peopleâteammates and stakeholdersâas possible. Itâs important that everyone has access to the most up-to-date research, and this way I avoid blank stares during important discussions.
Figure 4-3 depicts an example of a spreadsheet that I created using Google documents specifically for conducting competitive research. I am going to use the research that I conducted on the Busy Manâs Shopping Site for explanation and sample data. (As I first mentioned in the Preface, Iâve included a toolkit with this book. Itâs for you to use with your teams. Refer to it for details on accessing the Competitive Analysis Matrix.)
Your ultimate goal is to devise a solution that creates a competitive advantage. The market research your team does in the tool will force everyone to look across the competitive landscape with an eye for gaps or inconsistencies in how the competitors deliver their user experiences. The devil is in the details, and itâs in those details that Tenet 2, Value Innovation, can happen. (See Chapter 6 for more on this.)
When solid research is the input, solid analysis can be the output. This sounds obvious, but itâs amazing how many quick decisions are made after only a cursory examination of the marketplace. As strategists, we need to help our clients filter the market research into bite-size, actionable takeaways in which everyone can make smart, analytical decisions. Let me break it down slowly. At the end of this adventure, you will see that knowledge truly is power.
Understanding the Meaning of Competition
Letâs begin with some basics about conducting market research to analyze the competition. First letâs agree on the boundaries of the market. Take an index finger and draw a big circle in the air in front of you. Now, imagine that inside the circle is anybody on this planet who has regular (or consistent) access to the Internet. Anybody outside of the circle is everyone else. Letâs get rid of them and focus on the people inside the circle.
As digital product makers, the marketplace you all serve and dominate is the Internet. Itâs not only your marketplace; itâs your distribution medium. You and your team create for, deliver products to, interact with, and acquire more users than any other medium through this digital highway. This is why the Internet is far more powerful than traditional mediums like television and radio.
Another special thing about your marketplace is that it contains all of your existing and future customers. They can be either paying or nonpaying customers. They can be of almost any age range, so long as they can interact or engage with the product digitally. If a company in this space offers a product that is similar or even similar-ish to yours, they are your competitors. They have the ability to cut into your share of the potential two-plus billion people in the market.
However, not all of these two-plus billion people are necessarily your customers. (If you think they are, please reread Chapter 3, right now.) If you realize this from the start, it will be easier to pinpoint your competition.
Types of Competitors
A competitor is a person, team, or company that shares your goals and is fighting for the same thing that your product team wants. If you are entering a new market, there might be no true âdirect competitors.â Still, the chances are that the market for your product already exists, and you just might not know about it yet.
Direct competitors are companies that offer the same, or very similar, value proposition to your current or future customers. This means that the customers you want are alive right now and spending their time and money on the Internet using a direct competitorâs product instead of yours to solve their problemâwhether it is the best interface or not!
In my research for Paul the movie producer from Chapter 3, I found that the biggest direct competitor was a site called Trunk Club, shown in Figure 4-4.
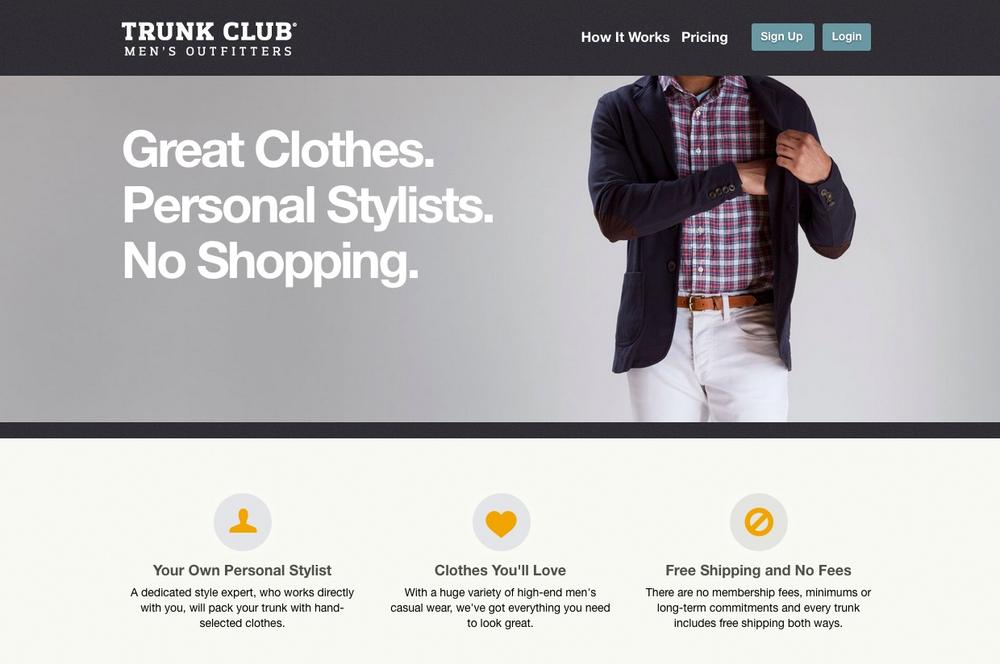
Trunk Club is a great solution for Paul the movie producerâs intended customer segment because Trunk Club addresses his hypothesized usersâ problems. For example, the Busy Man doesnât want to deal with annoying sales people. If the Busy Man joins the VIP-ish sounding âClub,â he also gets high-end clothing sent to him to try on in the privacy of his own home. That seems to hit all the points Paul brought up in Chapter 3, doesnât it? Thatâs why Trunk Club is a direct competitor.
Indirect competitors offer a similar value proposition to a different customer segment; or, they target your exact customer base without offering the exact same value proposition. For instance, an indirect competitorâs primary service might not be your value proposition, but their secondary service definitely is. Or, your customer base is using an aspect of an indirect competitorâs interface to solve the problem that our soon-to-be-amazing product will!
In my research for the Busy Manâs Shopping Site, I discovered that the online shopping site Gilt (see Figure 4-5) is an indirect competitor.

Gilt is an indirect competitor because it offers a partial solution to the Busy Man customer segment. With Gilt, the Busy Man could avoid annoying salespeople and get access to top brands. However, Gilt has a flash sales business model. That means that single products are only on sale for a brief period of time (perhaps just 24 hours). This makes it possible for Gilt to offer its targeted customer base deep discounts, but Paulâs intended customer base doesnât want that at the expense of flexibility and time. Time limits and curated selections would actually prevent Paulâs intended customers from putting together the personalized wardrobe of their dreams. So, although customers of the Busy Man could solve some of their big fashion needs with Gilt, it wouldnât be the their ideal solution.
But no matter, whether the competition is direct or indirect, the Internet is an intense marketplace. Make sure that you consider all of your competitors because they will affect the overall success of your product. The reality is that people often use products or combinations of products in ways that the product makers do not expect. (Remember what Ena discovered about hosts for wedding venues on Airbnb!) Research everything because that is how you and your team will ensure that you have an edge over others in your industry.
How to Find Your Competitors and Compile Your Competition List
There are many ways to learn who your direct and indirect competitors are. In fact, you will most likely begin to learn about competitors before you sit down to do the competitive analysis. During customer discovery or other research, users might share names of products theyâre using. During stakeholder interviews, the client, investors, and other product owners will probably drop the names of products they admire and want to emulate. Or, they might mention a product that theyâve heard is similar to what your team is proposing. Thatâs why itâs crucial to keep track of competitor names somewhere so that you donât forget them. Make a list somewhere in an email, word processing program, or a writing pad. Otherwise, you can jot the names down in your spreadsheet tool. Just track that list somewhere because you are going to need it very soon.
Of course, you could also stumble on a few products by surfing the current marketplace on the Internet. There are hundreds of web research tools for doing effective market research. Google, obviously, is the most popular search engine for doing generalized research. The advanced search filters are very powerful. However, it doesnât hurt to use Yahoo!, which is powered by Microsoftâs Bing, to compare result sets. I will dig into this method more deeply now by demonstrating how to build a competitor list for the Busy Manâs Shopping Site.
Searching for competitors
First, you look for direct competitorsâproducts that compete head-to-head with your value proposition. Paul the movie producerâs vision was of a platform for the busy, wealthy, and particular guy who wants to buy high-end products. Therefore, you need to figure out keywords the Busy Man might use to search for similar products. In this scenario, it might be a good idea to reverse engineerâhow would Paulâs customers search for a product? Here are some possible examples:
Menâs ecommerce site
Menâs shopping site
Top brands
Wardrobe online
Personal stylist
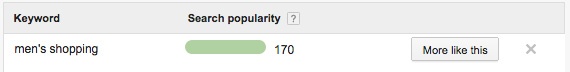
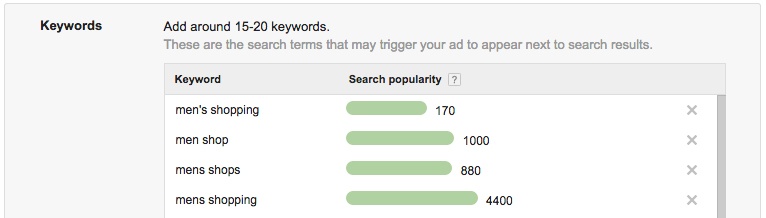
Ideally, you want to be as quick and precise as possible when scanning your results. What sets a professional web researcher apart from an amateur is how fast he is able to determine if the product matches your criteria. A good search result will often yield more than potential competitor websites on the search page, too. It will lead you to niche media platforms like blogs in which you can find âTop 10â or âBest ofâ articles from experts. These pieces of media are another great jumping-off point to find competitors. Other tactics include using Crunchbase, which collates the largest dataset of startup activity. You can also use advanced search tools such as the âmore like thisâ button within Google AdWords, as illustrated in Figure 4-6. Clicking the button opens the window shown in Figure 4-7. Itâs also a good idea to click through to the landing page of potential competitors. Read their About pages. Scan their products. Does it match your value proposition in any way? If it does, add the competitor to the list. If it doesnât, quickly click the Back button. Then, just rinse and repeat!
You wonât get much information about your industry if you only examine two or three competitors. Unless you really have hit a blue ocean and there are only a handful of competitors in your market, shoot for identifying the top five direct competitors and obtaining at least three indirect competitors. Otherwise, keep your list diverse with established competitors versus newer players who have recently entered the market. You want to get a panoramic view of how the new products might be more innovative to what best practices define their established competition.
Filling Out the matrix with data
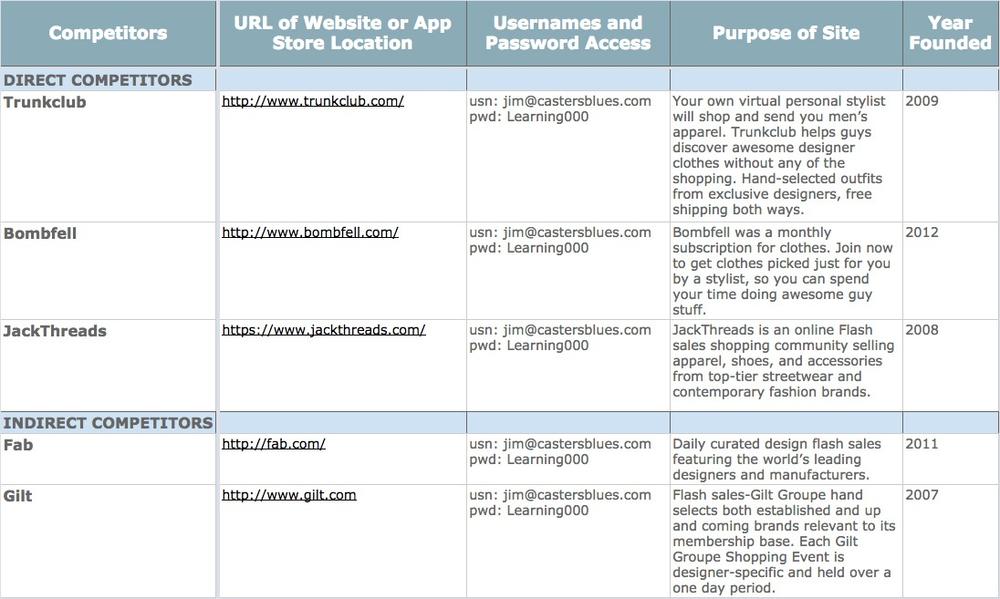
Now we have a list of direct and indirect competitors, and that means we can start gathering the rest of our data. Go ahead and open the Competitive Analysis Matrix from the UX Strategy Toolkit if your computer is handy.[32] As Figure 4-8 illustrates, Iâve provided a blank template for you to use. Plunk your competitor list into the leftmost column of the Y-axis.
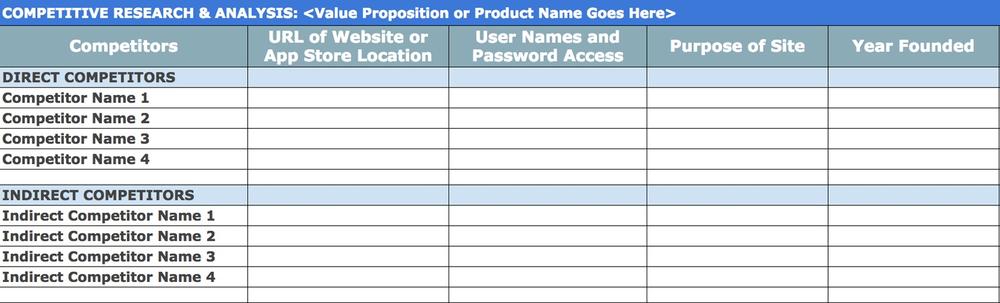
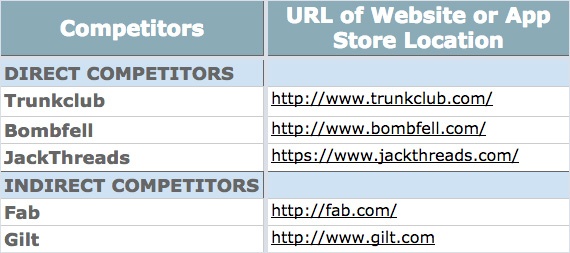
Separate the direct competitors from the indirect competitors. Include the website address or app store, too, as demonstrated in Figure 4-9 (for example, Google Play versus Apple Store). This is reference for your team and you. It will make it easier for you to double-check data and verify facts. The list will eventually need to be reorganized; I go over how to do that in Chapter 5, after you gather your research and are ready for the analysis. For the time being, I want to just focus on correctly capturing your research.
Okay, now take a deep breath, because we are about to jump into the labor-intensive process of conducting research and capturing results. Pace yourself so that you can capture data as quickly and thoroughly as possible. Try to also keep an open mind because the only bias you should have is whether or not the product is actually a competitor.
However, research can be time-consuming, so when you go down the rabbit hole, be sure to come up for air. For your first pass, spend up to an hour filling out as many cells as possible in each row. Set a timer for 30 minutes to give yourself a reality check at the halfway point. Less is more! Keep your documented research brief and to the point. This way, if you or anybody needs to refer back to the spreadsheet, it wonât require scanning excess or unrelated information.
If you look at our cloud example, youâll see how rows represent competitors, whereas columns represent competitor attributes (see Figure 4-10). The rightmost column is the analysis column, which you can ignore for now until Chapter 5, after you collect all your research.
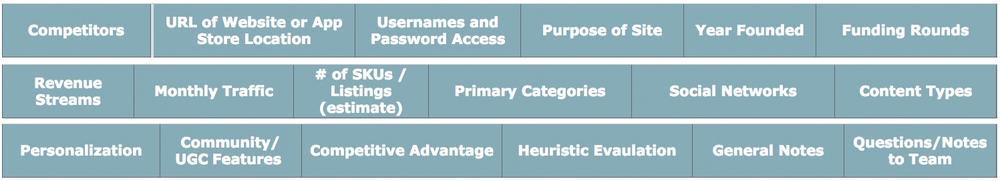
Weâre going to attack each row, evaluating each competitor based on a range of market and UX attributes. I will explain the attributes that need to be captured in each column. Not all of the attributes are applicable or relevant to all digital products. Just skip or delete the ones that donât apply to your product. There also might be attributes that need to be considered that are not in this spreadsheet; feel free to add anything relevant by adding a new column or replacing one that you donât need to use. What is crucial is that the pros and cons of the UX are clearly evaluated.
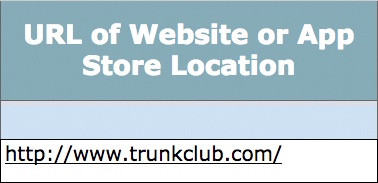
URL of website or app store location
This is where you put the primary online location that customers use to access the product. For desktop-only products, it will be the website address (URL), as depicted in Figure 4-11. For multiplatform products, you can list website URLs, links to app store preview pages, and so on. You want to make the information easy for your team to reference regardless of what device everyone has. They shouldnât all need to download an app to see how it looks. Here are sample links to the Waze app listing for Apple and Android:
If a product is a mobile app with a nonessential desktop counterpart used only for marketing or support (such as Tinderâs website, http://www.gotinder.com), itâs not crucial to list both platforms.
If you find that the competitorâs website and mobile app are both crucial to the customer experience of the product, I recommend that you break the competitors into two separate rows, especially if they offer distinct user experiences or feature sets (for instance, the Airbnb desktop versus the leaner mobile version). This way you can evaluate each platform separately.
Usernames and password access
To beat your competitors, you need to know exactly what they are doing. You want to know the unknowns. In many cases, the only way to learn this is through your competitorâs experience and/or sales funnel by becoming a user yourself. Thatâs right, you want to create an account or download the app. The column shown in Figure 4-12 is where you keep track of that information.

The benefit of tracking the access information is that it saves time for you and the rest of the team. They wonât have to create and pseudo-personalize a profile, too. This is especially useful if youâre researching a two-sided market in which you need two types of accounts (for example, buyer and seller). Donât be dumb when creating all of these new accounts, however. Be very cautious about the usernames, passwords, and the personal information you choose to share.
Here are a few pro tips:
Create one global username and password for use on all the products in your audit. It makes it a lot easier to remember and distribute to your team. Include a capital letter and number in your password because that criterion will be required by some of the products.
Donât ever use personal information such as your kidâs birthday, your own passwords, or profanity. You will potentially share this information with clients or colleagues.
Do not log on (single sign-on) using your personal or professional Facebook (or any social network) account ever.
If you are creating profiles on social networks, do not use your personal or work email address! Instead, create secondary accounts on Gmail or Yahoo first. Then, use these fake email accounts to create fake profiles.
If it is a transactional website you are researching, purchase something. If it is an app that you must purchase (versus a free one), pay for it. Donât be cheap! Itâs usually only a few dollars here or there. Having one user account for your entire team to learn from is worth the financial investment.
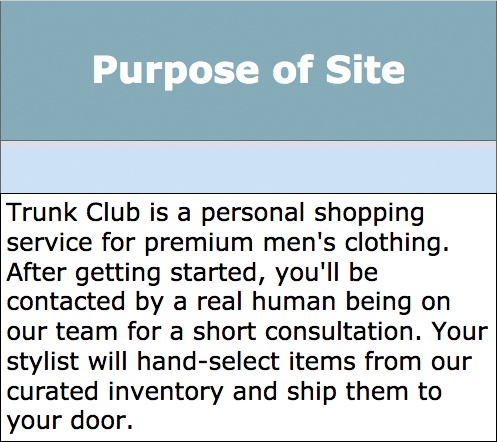
Purpose of site
The purpose of the site is why it exists; itâs basically the high-level description of the product or the value proposition. Think about how the competitor might explain it to a user or investor. As Figure 4-13 demonstrates, your description should be one to two sentences that describe the primary customer and the solution provided by the product.
You can often find this information by looking in the following places:
- âAboutâ or âAbout Usâ section
The value proposition is often written here by the competitor.
- Crunchbase
Both the âCompany Overviewâ and âDetailed Descriptionâ section have company descriptions.
- iTunes or Google Play app stores
The first two lines of the âdescriptionâ are generally what youâre looking for.
- Social networks such as Facebook, Pinterest, Twitter, and YouTube
These sometimes provide information about the value proposition.
- Online annual report
All publicly traded companies must release an annual report that often has a description of the company near the beginning of the report. Simply Google the competitorâs name and âAnnual Reportâ to find it!
Year founded
What year was this company founded or the product launched (Figure 4-14)? You should be able to find this in the same place you found the value proposition; for example, the About Us section, Crunchbase, and so on. Itâs useful information to have when you do the analysis, because you can see what players (products and/or services) are new to the market and whoâs been around for a while.

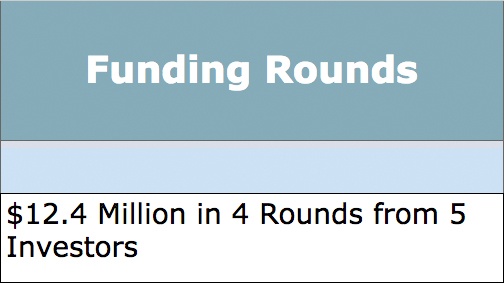
Funding rounds
A funding round is a discrete round of investment by which a business or other enterprise raises money to fund operations, expansion, capital projects, acquisitions, or some other business purpose.[33] (See Figure 4-15.) Again, the obvious places to find this information are Crunchbase and/or the competitorâs website. This information is important because competitors with funding have a competitive advantage.
Revenue streams
A revenue stream is how the product brings in money. As Figure 4-16 depicts, it could be via a transaction fee, advertising, monthly fees, or Software as a Service (SaaS), or by selling user data and trends to other companies. OkCupid is a dating site thatâs free for users. The company makes money through premium features and advertising. Facebook uses data mining as its first revenue model, selling competitive intelligence to third parties from unsuspecting users. eBayâs success hinges completely on users being able to easily buy from and sell to one another. Adobe charges a monthly SaaS fee for its cloud-based service.
How a product is potentially monetized should be directly tied to the UX strategy because thatâs what will make the product valuable to the user and the stakeholder. A successful competitorâs revenue model will probably reflect that. If youâre not sure how a certain competitor is monetizing its product, spend more time using its website. If the competitor wants to survive in the long run, it needs to eventually charge someone for something. Is there advertising on the website? Click the âAdvertise with Usâ link to see how it position itself. How do your competitors charge for membership? Look at their annual report if theyâre available.
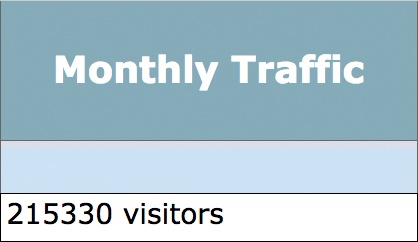
Monthly traffic
This is actually a measurable, quantifiable attribute. If you have access to Comscore, you can get super-accurate dataâtraffic (see Figure 4-17), minutes-on-site, and so on. about other websites. But there are also dozens of free websites that monitor monthly traffic. Usually all you need to do to get the data is type in the domain name of the site youâre researching. Check out Compete.com, Quantcast, and Alexa. You can pilfer free data from these sites and many others. By looking at multiple data points, you can triangulate an average of the traffic data, which is a lot better than not having any traffic data at all. For iPhone downloads and stats, there are great sites such as App Annie, AppFigures, Mopapp, and Distimo.
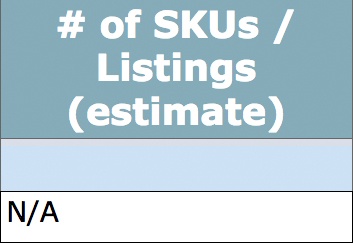
# of SKUs/listings
This cell is optional because this information is often difficult to ascertain. Here, you will track how many items or listings are available for the product. In the case of an ecommerce site like Zappos, youâll track SKUs (stock keeping units, see Figure 4-18). Each SKU represents one item for sale on the site. For example, on Zappos I can currently see that there are more than 13,828 menâs shoes (SKUs) for sale by simply clicking the link for the top level of the menâs shoes category. You could use this as a point of comparison to other sites selling in that category. In the case of a video-sharing or content-producing site, youâll want track how many videos/articles are actually on the site. In the case of a transactional product/platform, youâll want to know how much stuff is in there, even if itâs a rough estimate based on a few search queries.
The problem with this attribute is that thereâs no magic button that you can click to give you this information. In many cases, there are design conventions such as âinfinite scrollâ that prevent you from easily knowing how many more results could be displayed. Try searching for a common word that would apply to a lot of listings. For a clothing site, you could try a word like âshoeâ or âshirt.â The goal is for you to have data to compare. For example, what is the total result of one productâwatches, for exampleâacross multiple competitor products? You want to establish how empty or full the competitorâs site is. Is it actually offering what itâs promising to the user?
If itâs a social networking platform, try to determine how often and how many users are interacting with one another. You might get different results with a variety of word combinations. We are looking for something to estimate against, and you can change the title of the column so it more accurately reflects the substance of your data.
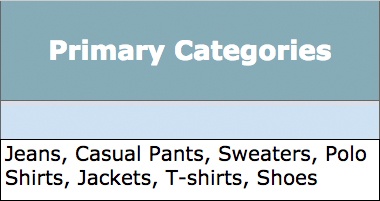
Primary categories
If the site is selling products (like Honda.com) or offering content (like Oprah.com), you need to understand how everything is categorized. The site probably (hopefully) already does this, so check out the siteâs global navigation menu. If the category list is small (womenâs, menâs, kidsâ, and so on), you can just copy that into your spreadsheet, as illustrated in Figure 4-19. If the list is long or complex, as on Amazon or eBay, the site is probably a horizontal marketplace. A horizontal market tries to meet the needs of a wide range of customers by offering products or services across many sectors. If youâre studying a horizontal marketplace, try to ascertain what the most active categories are. Look at whatâs featured on the home page. What does the site promote as âmost popularâ or âbest sellingâ? In either case, just include the categories that correlate to the products on the site. Donât include noncontent/product categories such as âAbout usâ or the Help section.
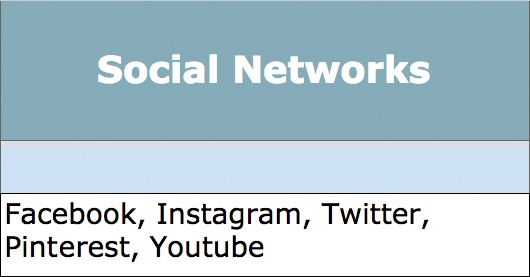
Social networks
Is the competitorâs brand also on Twitter, Facebook, or others? Which social platforms is it truly using? Most products these days integrate with these platforms, but they donât fully leverage anything with all of them. Figure 4-20 shows that you need to determine what social media strategy each competitor is trying to harness well. You can find most of this information by simply searching the productâs name on Twitter, Facebook, Instagram, Pinterest, and any other popular relevant social platform, or by just checking out the competitorsâ sites.
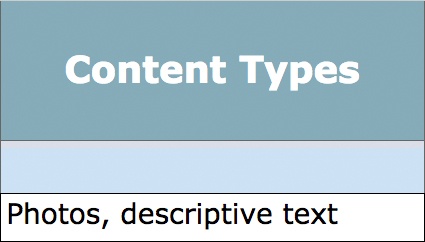
Content types
Use this to capture what type of content is on the competitorâs site, as depicted in Figure 4-21. Is the bulk of the content text, photos, or video? How much content dominates the site and how is it presented? Is the content well organized? Is it easy to scan and/or read? How detailed and informative is the information displayed on the product detail pages?
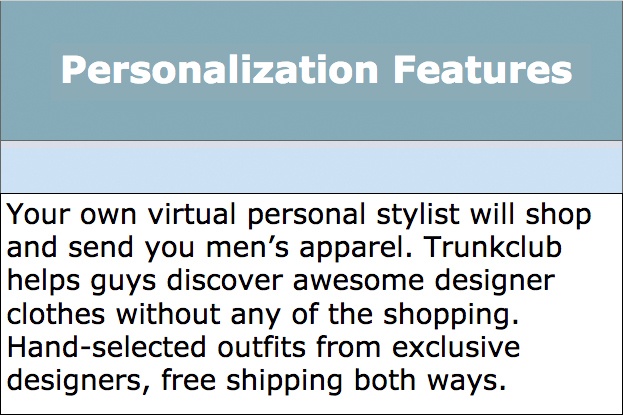
Personalization features
Personalization, shown in Figure 4-22, is one of the most crucial features to get customers engaged with an application or website. It should provide a value-added experience. On Airbnb, Amazon, or eBay, you donât need to be logged on to perform a basic search. However, you will need to log on as soon as you want to take an action (for example, save to favorites or make a purchase). The more time people spend personalizing their experience, the more engaged they will get with the product. (Think: Facebook!) Personalization features include favoriting, watch lists, user profiles, wish lists, custom content experiences, custom interface experiences, messaging, saved shopping carts, and so on. Sign up for the competitorâs newsletters, too.
Another way to check out the personalization features is to go to the âMy Accountâ section of each competitor. See what the site or app allows you to do thatâs particularly useful and helps achieve the value proposition. How can customers customize their experience? Is the experience stickyâmeaning so engaging that the user will really want to âstickâ to this product? Does it display the userâs name? Does it remember and display the last item the user looked at? Does it let the user make a list of favorite items? As you look at all of the competitors, it will soon become obvious which personalization features are crucial and which are not.
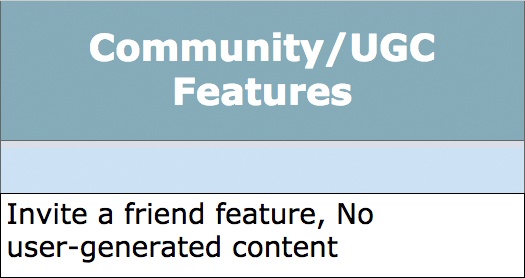
Community/UGC features
User-generated content (UGC) or crowd-sourced content is content that is created by the users. Some products such as Yelp, Waze, eBay, and Airbnb would be useless without user-generated content. In contrast, brands like Levis and ABC have mostly editorial content. Editorial content is created by people who work for or associate professionally with the site. In this column, you want to estimate the amount of user-generated content versus the amount of editorial content, as illustrated in Figure 4-23. You want to get a sense of where most of the content is coming from.
Look for features like message boards, the ability to post content (reviews, stories, and so on), and user comments. Be specific about which features are crucial and try to cite concrete examples of how they bring value to the productâs other customers.
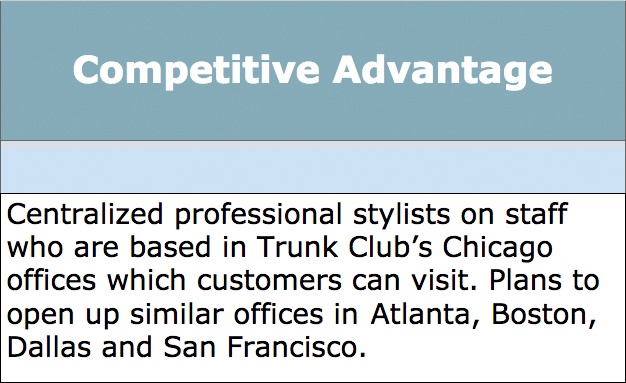
Competitive advantage
Think different! Differentiators are distinct features that a product provides that are not found in its competitors. They give a product a competitive advantage, such as those depicted in Figure 4-24. They can be a combination of attributes that make the product better. Some attributes might be specific to the online experience and others to the offline experience.
For instance, Zappos made a name for itself by providing an amazing customer experience. It is known for having a great browsing experience as well as simplifying product returns. Vineâs initial differentiator was how easy it was to record a video by touching anywhere on the screen. What makes it different now is that itâs a massive social network owned by Twitter. Kayak had the ability to filter live search results long before Priceline did. Kayak made the experience even better by providing the simplest of interactive patternsâa sliderâto make this live filtering fun.
Figure out the top three differentiators of each product and list them in this cell. Ask yourself questions such as which features were successful because the product was first-to-market? Can those features be easily replicated? Which is better, the filtering or the large database of options? Which attributes are specific to the online experience?
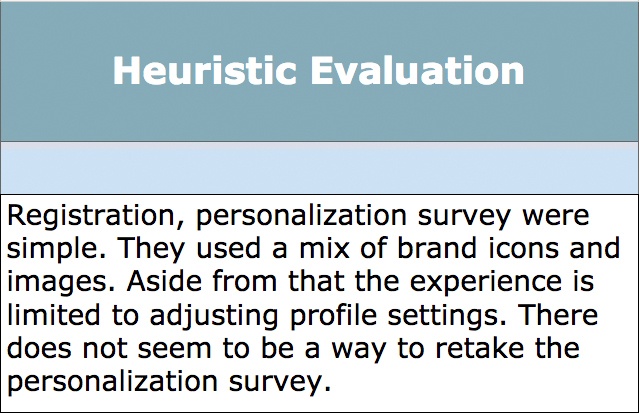
Heuristic evaluation
Heuristic is a fancy word that means experimentation and trial-by-error. In other words, get firsthand experience using the product to see how it works for you, personally. What do you think?
You basically want to quickly evaluate whether the site is usable. You probably donât have time for anything exhaustive, so just do a quick evaluation, such as that shown in Figure 4-25, and give the product an overall grade of âAâ to âF.â You can use the following questions as a guide:
Does the experience allow the user to easily accomplish her primary goal? Is it intuitive?
Are the navigation, page/screen layouts, and visual design consistent?
Is it easy to find, search, and browse the content or services being offered?
Is the user feedback (for instance, error messaging) satisfactory? Is there a live help or a support system in place?
Customer reviews
This is a summary of the amount (that is, hundreds or thousands) of customer reviews that you can find on a product outside of its website. For mobile apps, you can find these in the app stores where you download the product. For websites, you can sometimes find these on Quora or other similar message-board platforms where users reach out to the general public for troubleshooting advice. You are looking for the latest recurring customer complaints about a product because those potential pain points are something your team might be able improve upon.
General/miscellaneous notes
This is miscellaneous information that doesnât fit into the other columns. You can use this for any research relevant to your product that you want to track. Feel free to change the name of this column if needed.
Questions/notes to team or self
Remember this is a collaborative document. Other people will be reading your research as you fill it out and could provide valuable information. Thus, you might put things in here such as, âThis site doesnât work on Chrome not sure if itâs me.â âHey Steve, do you think you can expense a pair of shoes on this site so we can see how the entire transaction works?â
Sometimes, you will have a miscellaneous note that you want to remember. You can also use this column as a parking lot for attributes that need to be examined across all sites.
Analysis
You get to skip this for now until you finish up all the other competitors. Chapter 5 covers how to do the analysis section.
One last note: often product teams and stakeholders donât keep an eye on the market after theyâve moved on from the research process. However, this is a mistake because the Internet is a fast-moving target. Things change really fast. The competitive landscape is always shifting; consequently, competitive research will never be final. One competitor might tank but two others will pop up. Itâs like playing whack-a-mole. For instance, I did the competitive research for the Busy Man Shopping Site in 2012. Iâm sure if you look at the landscape now, itâs very different. Thatâs why you and your team always need to be on your toes, agile, and ready to grab your competitorâs newest ideas and immediately see how they might affect your product vision.
Recap
To build something unique, you cannot ignore your competition. In this chapter, I discussed how to conduct competitive research to learn about the marketplace. You learned how to identify direct and indirect competitors. You relentlessly searched the Web, capturing a range of qualitative and quantitative data points to help understand what kind of marketplace your product might be entering. Now, itâs time to analyze that grid and extract meaningful intelligence that will inform the UX. That might sound complicated, but donât panic. Just move on to Chapter 5.
Get UX Strategy now with the O’Reilly learning platform.
O’Reilly members experience books, live events, courses curated by job role, and more from O’Reilly and nearly 200 top publishers.

