Infographics
An infographic is a visual chart or diagram used to represent information or data. To find examples, just do a Google Image search for "infographics". Infographics can get quite large, which makes them difficult to view on a desktop computer screen, let alone a mobile phone. However, we have virtually infinite space to work with in VR. Let's take a look.
I came across this awesome Histomap chart depicting the history of the world, produced in 1931 by John B. Sparks for Rand McNally. The original is 158 cm tall by 31 cm wide, with an aspect ratio of about 1:5. We'll map it onto a half of the cylinder. That's 180 degrees, twice:
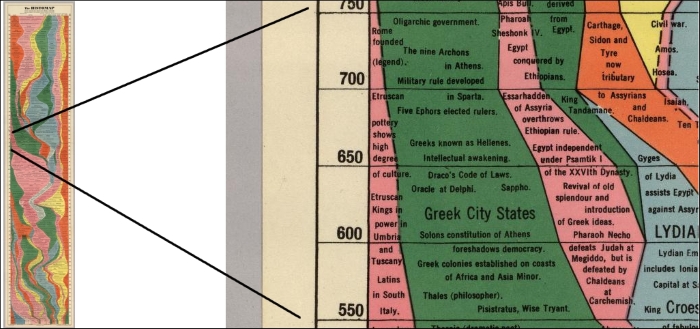
Histomap ...
Get Unity Virtual Reality Projects now with the O’Reilly learning platform.
O’Reilly members experience books, live events, courses curated by job role, and more from O’Reilly and nearly 200 top publishers.

