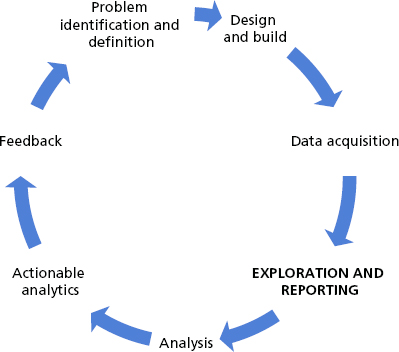
Chapter 4Exploration and Reporting
The world of data exploration is ruled by reporting and visualization . . . thoughts on slice and dice
It was 2006, and I was in India. In a daze of humidity and heat, I was wondering, “How can we implement business analytics functionality in a financial enterprise in a country like India?” As I passed underneath a tangled web of electrical wires, I heard my name. “Hello, Al!” A man was following my winding path through a crowd of brightly colored saris, moving effortlessly behind me. I turned around and walked to greet him. I had spent time with him over the phone in the past few weeks.
At that moment, I thought to myself, “I’ve built a brand-new data warehouse with lots of data stored neatly inside. What am I going to do with it?” Climbing through the beautiful and ancient city of Delhi, big data are on my mind.
I am here in Delhi to observe a colleague of mine, Sanjiv, teach his staff about business intelligence, a.k.a. reporting. He will be leading a class on big data, emphasizing that the first and most important use of new analytical platforms is effective visualization. Alternatively, reporting can be used to support statistical analysis, that is, modeling.
I shook Sanjiv’s hand and after an exchang of pleasantries, we launched into the topic at hand. “Current reporting is definitely not our father’s reporting. I remember waiting ...
Get Understanding the Predictive Analytics Lifecycle now with the O’Reilly learning platform.
O’Reilly members experience books, live events, courses curated by job role, and more from O’Reilly and nearly 200 top publishers.

