Dashboard and Reporting tabs
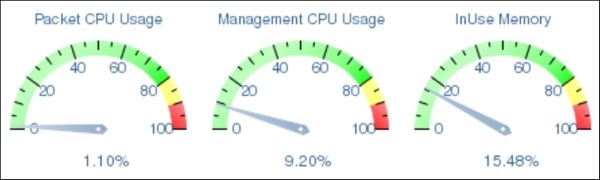
NetScaler provides a couple of very useful GUI utilities in the Dashboard and the Reporting tabs. The Dashboard tab allows you to get a quick glance of the vital parameters of the NetScaler, such as what the current CPU and memory levels are.
Dashboard also provides you with a number of built-in graphs that allow you to plot traffic and connection characteristics. A popular example is the client versus server connections. The following screenshot shows equal numbers, a sign that there is not a lot of connection multiplexing happening:
Another useful purpose that the Dashboard serves is as an event viewer. The Event logs ...
Get Troubleshooting NetScaler now with the O’Reilly learning platform.
O’Reilly members experience books, live events, courses curated by job role, and more from O’Reilly and nearly 200 top publishers.

