ADVANCED CHARTING TECHNIQUES
The general absolute return strategy of combining trend lines and trend channels can be further improved by adding a few sophisticated advanced patterns.
The following discussion draws readers’ attention to a selection of specific chart analysis tools by introducing support and resistance lines, 5-point horizontal trend channels, and diagonal trend lines.
Support and Resistance Lines
Chartists generally agree on a few basics as far support and resistance lines are concerned. For example, support and resistance levels may alternate in uptrends or downtrends. A support level can become a resistance level and vice versa.
Figure 4.33 provides an ideal-typical price move from which the possible alternation of support and resistance levels in market uptrends as well as in market downtrends can be derived.
FIGURE 4.33 Alternation of Support and Resistance Levels in Market Uptrends and Downtrends
Source: www.Fibotrader.com, 2010.
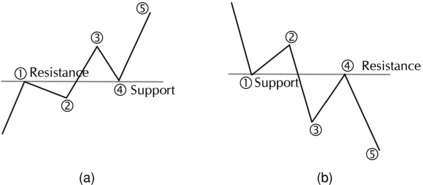
In a regular 5-wave price swing in an uptrend, a correction will occur after peak 1 is formed. Once the correction is over, as soon as valley 2 has been built and the market price moves in the direction of the first impulse wave, peak 1 becomes the resistance level. If the market moves higher and forms peak 3, peak 1 becomes the support level.
In a regular 5-wave price swing in a downtrend, a correction will occur after valley 1 is ...
Get Trading with Charts for Absolute Return now with the O’Reilly learning platform.
O’Reilly members experience books, live events, courses curated by job role, and more from O’Reilly and nearly 200 top publishers.

