CANDLESTICK CHART PATTERNS
Candlestick chart patterns show trend accelerations, slowdowns, and reversals. Candlestick charts are popular because they identify the momentum in a price move on every price bar by comparing the opening price with the closing price and showing black and white candlesticks, depending on whether the opening is higher or lower than the closing price. They are good trading tools by themselves, but they also combine well with other trading tools.
Basic Features of Candlestick Charts
Candlestick charts are based on the same market data as regular bar charts but visualize data in a different way. The components of a candlestick chart are the opening price level, the closing price level, and the high price and low price of any data compression rate, be it weekly, daily, or intraday data. Figure 3.26 shows the composition of a candlestick.
FIGURE 3.26 Constituents of Candlesticks
Source: Robert Fischer and Jens Fischer, Candlesticks, Fibonacci, and Chart Pattern Trading Tools, John Wiley & Sons (2003), p. 25.
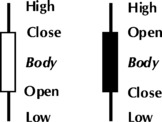
The relationship between the opening price level and the closing price level forms the body of a candlestick chart.
If the close is below the opening price, the body is black. If the close is above the opening price, the body is white. The opening price and the closing price of every data compression—weekly, daily, or intraday—is therefore important for ...
Get Trading with Charts for Absolute Return now with the O’Reilly learning platform.
O’Reilly members experience books, live events, courses curated by job role, and more from O’Reilly and nearly 200 top publishers.

