CHAPTER 6
Trading Stocks for Absolute Return
No other market is as subject to events, arguments, and upheavals on the different levels of economics and finance as the stock market. Not only does it reflect the economic situation, but also success and failure of a government.
The performance of the world-famous Magellan Fund may explain what is meant. Figure 6.1 shows the performance of the Fidelity Magellan Fund over the last 10 years.
FIGURE 6.1 Magellan Fund: Performance Profile 2001+
Source: Fidelity Web site. http://fundresearch.fidelity.com/mutual-funds/summary/316184100
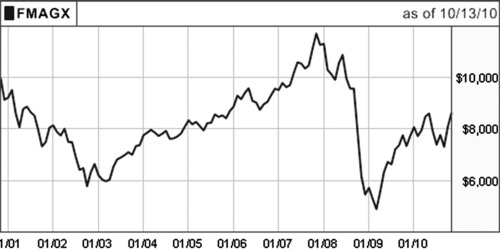
The total performance over the last 10 years starting in 2001 is a net loss of about 2 percent; the maximum drawdown exceeds 50 percent. No wonder investors are in doubt about what the fund managers are doing, with all of the experts at hand. Even the smallest investor could have had as good performance by investing in an S&P 500 Index–based ETF.
Previous chapters described how to achieve absolute return results based on trend lines and/or trend channels or by using PHI-ellipses as Fibonacci-related graphical trading tools on stock index futures, financial futures, and cash currencies in the Forex markets. This final chapter will show that absolute return results can be generated on stocks as well, based on the same general principles of successful chart-oriented trading explained in previous chapters.

