RESISTANCE IN STRAIGHT-LINE RUNS
I cataloged resistance in straight-line runs just as I did with support. Only this time I used 300 stocks to find enough samples over the same two-year duration. Figure 4.7 shows an example.
Figure 4.7 A straight-line run down forms resistance to an upward price trend.
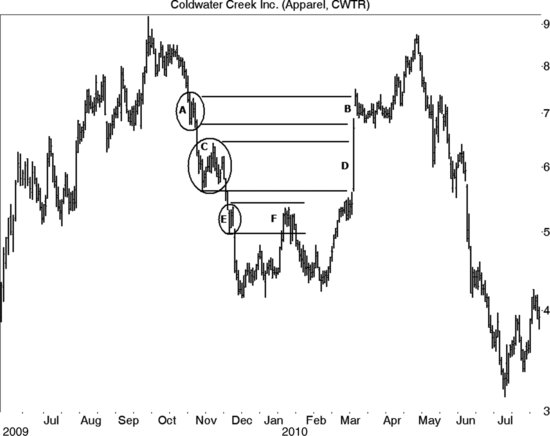
Price forms a small resistance zone at A, reaches it at B, and stalls. At C, a larger resistance area forms, but this is a loose looking one. At D, price just breezes past C as if the resistance area were not there. At E, another resistance area lasts just a few days and yet it was powerful enough to repel prices at F.
Testing for resistance in a downward straight-line run finds that the first area (A), shows overhead resistance 177 out of 258 times, or 69 percent. Area C shows future resistance 66 out of 90 times or 74 percent. Zone E is rare in a bull market. I only found 19 samples out of 25 tries, or 76 percent, where the area acted as resistance.
- In a straight-line run downward, price sets up future resistance between 69 percent (first highest resistance area) and 76 percent (third highest resistance area) of the time.
Let me emphasize that just because a congestion area appears in a straight-line run is no reason to believe that price will reverse there. I did not check for a lasting reversal, only that price paused there, finding either support or resistance in the consolidation ...
Get Trading Basics: Evolution of a Trader now with the O’Reilly learning platform.
O’Reilly members experience books, live events, courses curated by job role, and more from O’Reilly and nearly 200 top publishers.

