WHAT IS HOLD TIME LOSS?
Before buying a stock, traders and investors should ask, “Where do I put my stop?” That is a simple question with a complex answer. “Use a volatility stop” is my usual reply, and I will discuss the various types of stops in a moment.
Here is another way to answer the question. Research shows that using a stop hurts profits. The problem is that stops take you out of winning trades too early (which we saw in the last chapter). Thus, you need to know how far below the buy price to place a stop to keep you in winning trades.
I looked at all of my winning trades (excluding day trades). For the time I held the stock, I computed the maximum drop below the buy price for each trade. This is not the drawdown, which is the largest equity drop from peak to valley, but the largest potential loss during the life of the trade. I call it the hold time loss. Table 3.2 shows a frequency distribution of the hold time loss.
Table 3.2 Hold Time Loss Frequency Distribution for Winning Trades
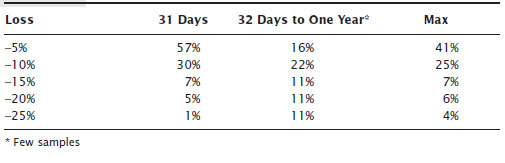
For example, of those trades lasting less than a month, 57 percent of them had potential losses of 5 percent or less and 87 percent (57 percent + 30 percent) of them dropped 10 percent or less. That makes sense because stocks often do not fall very far in short periods.
If you ignore the hold time, the right column in the table shows that 41 percent of all winning trades had potential losses ...
Get Trading Basics: Evolution of a Trader now with the O’Reilly learning platform.
O’Reilly members experience books, live events, courses curated by job role, and more from O’Reilly and nearly 200 top publishers.

