3.9. CLOSING IN ON THE TOP
Verisign and Oracle continued to move higher in the first quarter of 2000, but there were enough warning signs to signal that it was perhaps time to exit the stocks, particularly as we moved into March 2000 when many big leaders were showing climactic types of upside price action typical of "climax tops." Oracle, shown in Figure 3.16, built a short double-bottom type of formation in January 2000 and bounced off its 50-day moving average on the second low of the double-bottom, which was in fact the very first time the stock pulled back to that key moving average since it broke out and began its price move in late October 1999. This was a textbook secondary buy point, and the stock moved up off the moving average and into new high ground in February 2000. In March the stock began to swing erratically, pulling down over 30 percent in late March and then swinging right back up to its highs—volatility that was out of character for the stock.
Figure 3.16. Oracle Corp. (ORCL), daily chart, 1999–2000, the last run to the top in March 2000.: Chart courtesy of eSignal, Copyright 2010
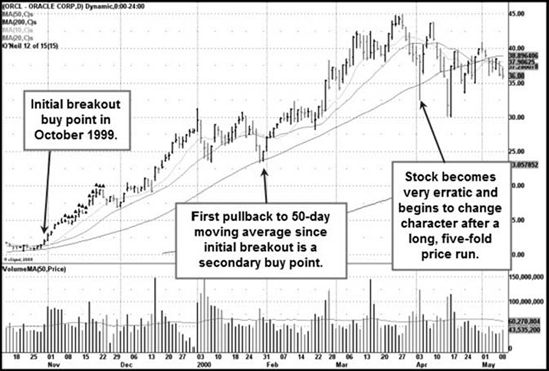
Figure 3.17. Verisign, Inc. (VRSN) daily chart, 1999–2000. A flawed late-stage base fails.: Chart courtesy of eSignal, Copyright 2010

Verisign, meanwhile, shown in Figure 3.17
Get Trade Like an O'Neil Disciple: How We Made 18,000% in the Stock Market now with the O’Reilly learning platform.
O’Reilly members experience books, live events, courses curated by job role, and more from O’Reilly and nearly 200 top publishers.

