A point in space can be represented using the Cartesian coordinate using two numbers x and y. The same point can also be represented in the polar coordinate by using the distance from the origin (r) and the angle from the x axis (theta), as shown in the following diagram:
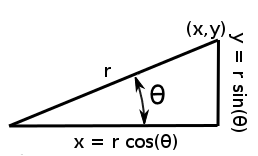
To convert between polar and Cartesian coordinates, we use the following equalities:
x= r cos(θ) and y = rsin(θ)
It is easier to plot equations expressed in terms of r and θ on a special kind of graph called the polar plot, which is divided into small concentric circles and radial lines emanating from the center. The radial lines are normally spaced ...

