Graphing with Tkinter
Tkinter is not a graphing tool. However, should you need to draw graphs with Tkinter, you can use the Canvas widget to draw graphs.
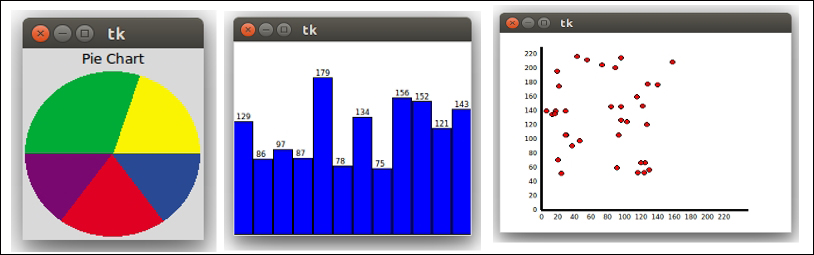
In this iteration, we will draw the following graphs:
- Pie chart (
7.13_pie_chart.py) - Bar graph (
7.14_bar_graph.py) - Scatter plot (
7.15_scatter_plot.py)
The three graphs show up as follows:
Let's look at the pie chart first. You can easily create a pie chart in Tkinter using the Canvas widget's create_arc method.
The create_arc method has the following signature:
item_id = canvas.create_arc(x1, y1, x2, y2, option, ...)
Point (x1, y1) is the top-left corner and point (x2, y2) is the bottom-right corner of ...
Get Tkinter GUI Application Development Blueprints now with the O’Reilly learning platform.
O’Reilly members experience books, live events, courses curated by job role, and more from O’Reilly and nearly 200 top publishers.

