BASIC VOLUME PLOTS
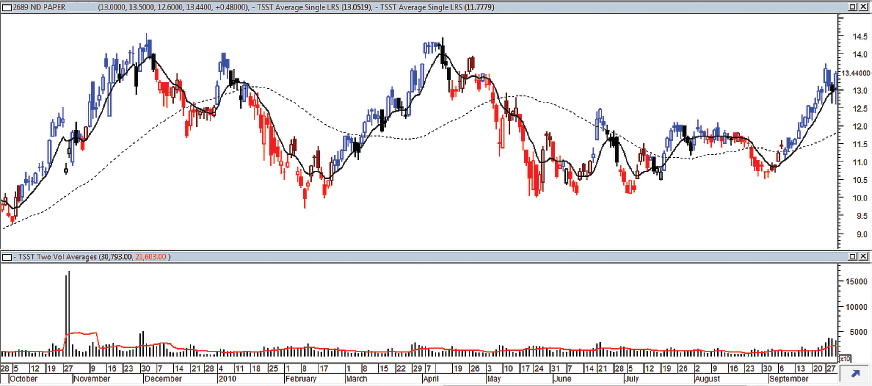
One approach to determining the volume trend is to plot two average lines of volume, a fast- and a slow-moving average. This has the advantage of showing a potential change in trend when the fast average line crosses above the slow average line. (See Figure 5.2.)
FIGURE 5.2 The histogram bars of the volume in the lower window are plots of the 2-day average, while the red line represents the 10-day average.
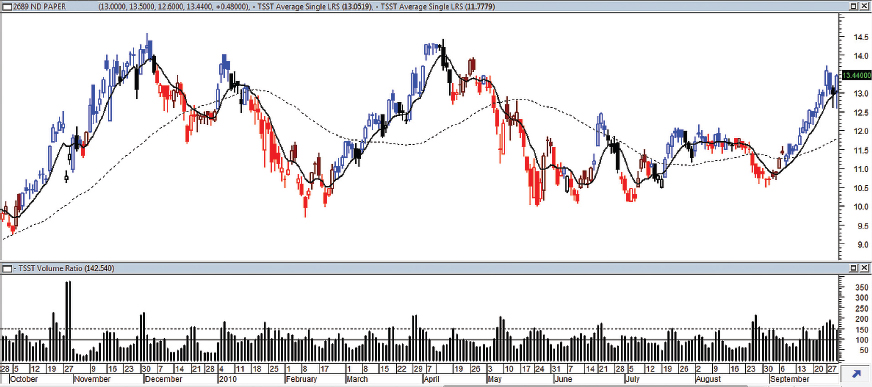
Another method is to plot a comparison of the longer-term average to a shorter-term average by percentage, as shown in Figure 5.3.
FIGURE 5.3 The volume is plotted as a percentage ratio between its 2-day average and 10-day average.
Get Timing Solutions for Swing Traders: A Novel Approach to Successful Trading Using Technical Analysis and Financial Astrology now with the O’Reilly learning platform.
O’Reilly members experience books, live events, courses curated by job role, and more from O’Reilly and nearly 200 top publishers.

