Collection of Time Series Used for Examples in the Text and in Exercises
| Series A | Chemical process concentration readings: every 2 hours |
| Series B | IBM common stock closing prices: daily, May 17, 1961–November 2, 1962 |
| Series B′ | IBM common stock closing prices: daily, June 29, 1959–June 30, 1960 |
| Series C | Chemical process temperature readings: every minute |
| Series D | Chemical process viscosity readings: every hour |
| Series E | Wolfer sunspot numbers: yearly |
| Series F | Yields from a batch chemical process: consecutive |
| Series G | International airline passengers: monthly totals (thousands of passengers) January 1949–December 1960 |
| Series J | Gas furnace data |
| Series K | Simulated dynamic data with two inputs |
| Series L | Pilot scheme data |
| Series M | Sales data with leading indicator |
| Series N | Mink fur sales of the Hudson's Bay Company: annual for 1850–1911 |
| Series P | Unemployment and GDP data in UK: quarterly for 1955–1969 |
| Series Q | Logged and coded U.S. hog price data: annual for 1867–1948 |
| Series R | Monthly averages of hourly readings of ozone in downtown Los Angeles |
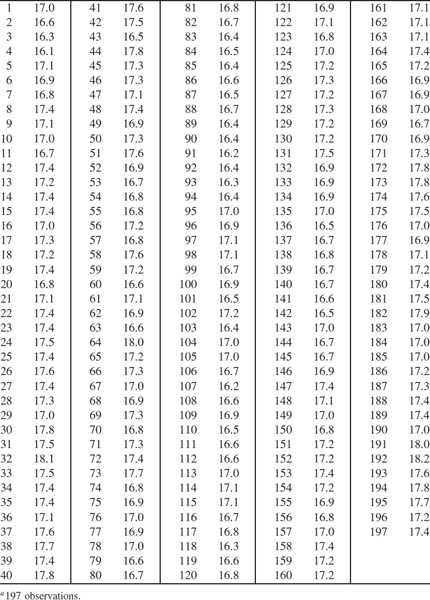
Series A Chemical Process Concentration Readings: Every 2 Hoursa
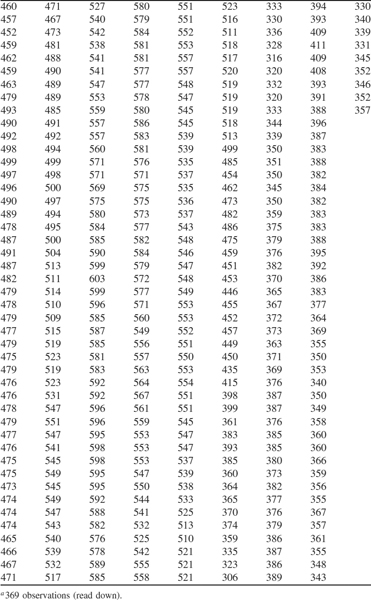
Series B IBM Common Stock Closing Prices: Daily, May 17, 1961–November 2, 1962a
Series B′ IBM Common Stock Closing Prices: Daily, June 29, 1959-June ...
Get Time Series Analysis: Forecasting and Control, Fourth Edition now with the O’Reilly learning platform.
O’Reilly members experience books, live events, courses curated by job role, and more from O’Reilly and nearly 200 top publishers.

