Annotating visualizations with reference lines, fitted curves, and error bars
Adding horizontal and vertical lines to a visualization to indicate limits or boundaries can significantly enhance the information you wish to convey. Take, for example, the batting performance visualization we created in Chapter 5, Source Data is Never Enough. We colored by quadrant, and we can further enhance that visualization by adding appropriate reference lines.
- Open the scatter plot's visualization properties and select Lines & Curves. You can use any pre-existing vertical and horizontal lines or select from the drop-down list provided by the Add button.
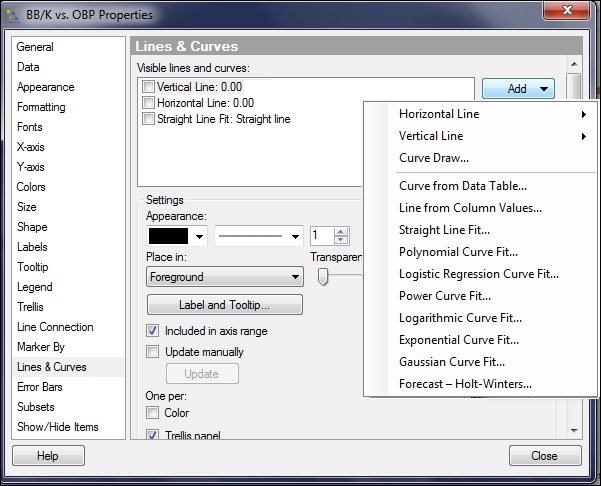
- Check the ...
Get TIBCO Spotfire – A Comprehensive Primer now with the O’Reilly learning platform.
O’Reilly members experience books, live events, courses curated by job role, and more from O’Reilly and nearly 200 top publishers.

