Enhancing tabular presentations using graphical tables
The Graphical Table visualization is an enhanced version of the Table visualization that allows you to pack a lot more visual information into the presentation. Alongside regular table columns, you can add sparklines, calculated values, conditional icons, and bullet graphs.
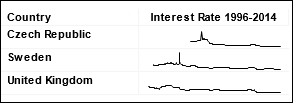
Sparklines are miniature line charts. You could, for example, create a graphical table of countries with a sparkline showing the interest rate in each country over time.
Calculated values are simply calculations, usually involving aggregation of the data. For example, we could list our baseball teams and provide a column for ...
Get TIBCO Spotfire – A Comprehensive Primer now with the O’Reilly learning platform.
O’Reilly members experience books, live events, courses curated by job role, and more from O’Reilly and nearly 200 top publishers.

