Enriching your visualizations with color categorization
Color is a strong feature in Spotfire and an important visualization tool, often underestimated by report creators. It can be seen as merely a nice-to-have customization, but paying attention to color can be the difference between creating a stimulating and intuitive data visualization rather than an uninspiring and even confusing corporate report. Take some pride and care in the visual aesthetics of your analytics creations!
Let's take a look at the color properties of the Table visualization.
- Open the Table visualization properties again, select Colors, and then Add the column Runs.
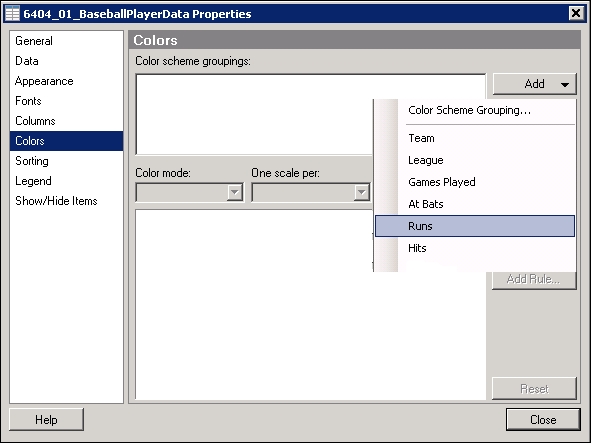
- Now, you ...
Get TIBCO Spotfire – A Comprehensive Primer now with the O’Reilly learning platform.
O’Reilly members experience books, live events, courses curated by job role, and more from O’Reilly and nearly 200 top publishers.

