Part IV
Working with Probability and Statistics
 Learn to use lists to find the standard deviation of a data set at
 www.dummies.com/extras/ti84plus.
In this part . . .
![]() Get a look at calculating factorials, permutations, combinations, and even generating random numbers.
Get a look at calculating factorials, permutations, combinations, and even generating random numbers.
![]() See how to enter and sort data in a list and use formulas to generate a data list.
See how to enter and sort data in a list and use formulas to generate a data list.
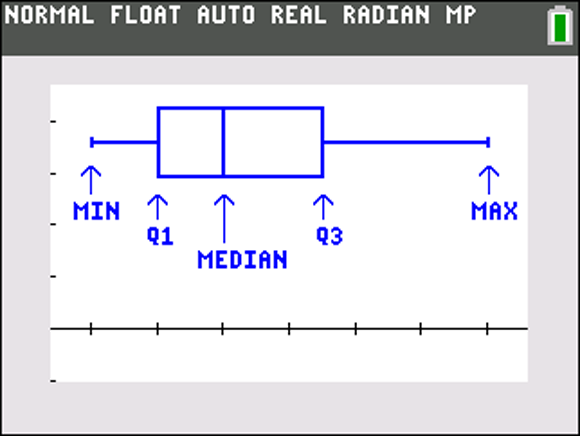
![]() Find out how to use regression to find the curve of best fit and display the data as a histogram or box plot.
Find out how to use regression to find the curve of best fit and display the data as a histogram or box plot.

