14.2. REGRESSION AND CORRELATION ANALYSIS
14.2.1. Scatter plots
Definition—A scatter diagram is a plot of one variable versus another. One variable is called the independent variable and it is usually shown on the horizontal (bottom) axis. The other variable is called the dependent variable and it is shown on the vertical (side) axis.
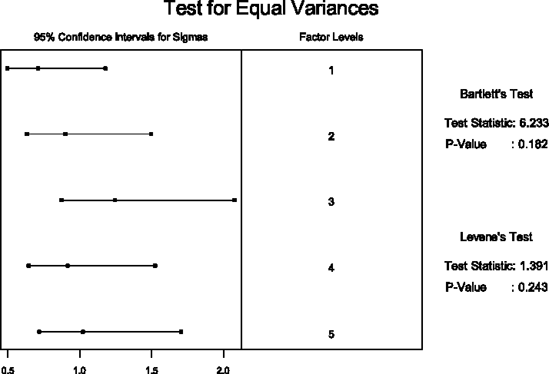
Figure 14.3. Output from Minitab's test for equal variances.
Usage—Scatter diagrams are used to evaluate cause and effect relationships. The assumption is that the independent variable is causing a change in the dependent variable. Scatter plots are used to answer such questions as "Does vendor A's material machine ...
Get The Six Sigma Handbook, Revised and Expanded, 2nd Edition now with the O’Reilly learning platform.
O’Reilly members experience books, live events, courses curated by job role, and more from O’Reilly and nearly 200 top publishers.

