Complex 3D plots with wireframe
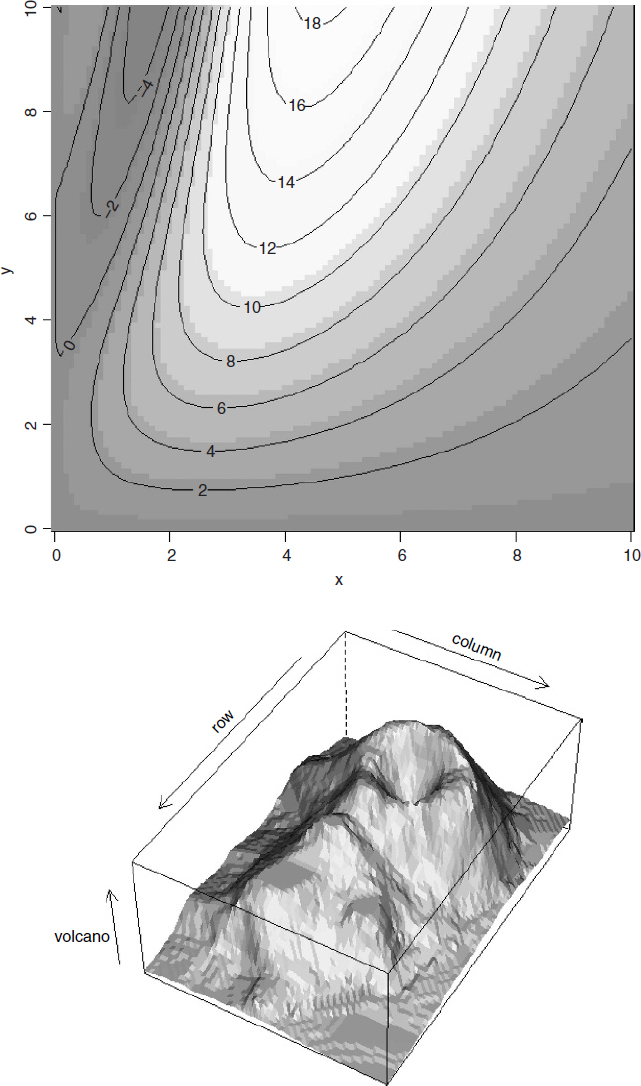
If you want to create really fancy 3D graphics you will want to master the wireframe function, which allows you to specify the location of the notional light source that illuminates your object (and hence creates the shadows). Here are two examples from demo(trellis) that produce pleasing 3D objects. In the first case, the surface is based on data (in the dataframe called volcano), whereas in the second case (strips on a globe) the graphic is based on an equation (z ~ x * y). It is in library(lattice). This is how wireframe is invoked:
wireframe(volcano, shade = TRUE, aspect = c(61/87,
   0.4), screen = list(z = -120, x = -45), light.source = c(0,
   0, 10), distance = 0.2, shade.colors = function(irr, ref,
   height, w = 0.5) grey(w * irr + (1 - w) * (1 - (1 - ref)^0.4)))
Next, we see a shaded globe with the surface turned into strips by leaving out every other pair of coloured orbits by setting their values to NA.
n < - 50
tx<- matrix(seq(-pi, pi, len = 2 * n), 2 * n, n)
ty<- matrix(seq(-pi, pi, len = n)/2, 2 * n, n, byrow = T)
xx < - cos(tx) * cos(ty)
yy <- sin(tx) * cos(ty)
zz <- sin(ty)
zzz <- zz
zzz[, 1:12 * 4]<- NA
Now draw the globe and shade the front and back surfaces appropriately:
wireframe(zzz ~ xx * yy, shade = TRUE, light.source = c(3,3,3))
Get The R Book now with the O’Reilly learning platform.
O’Reilly members experience books, live events, courses curated by job role, and more from O’Reilly and nearly 200 top publishers.

