Logarithmic Axes
You can transform the variables inside the plot function (e.g. plot(log(y) ~ x)) or you can plot the untransformed variables on logarithmically scaled axes (e.g. log="x").
data<-read.table("c:\\temp\\logplots.txt",header=T)
attach(data)
names(data)

[1] "x" "y"
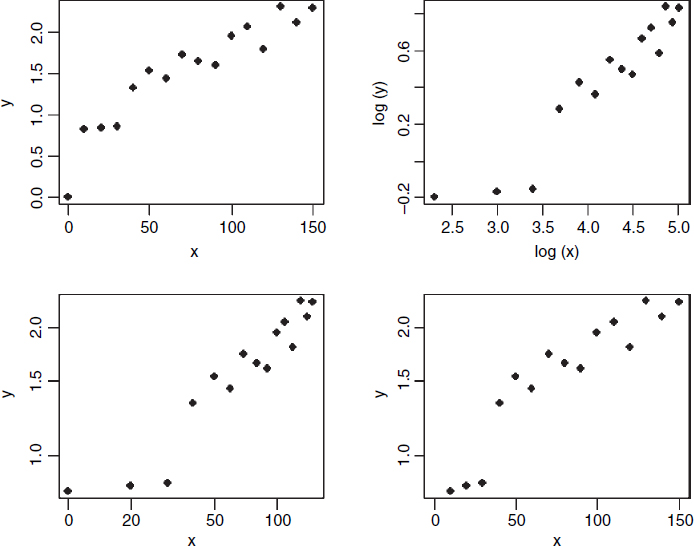
par(mfrow=c(2,2))
plot(x,y,pch=16)
plot(log(x),log(y),pch=16)
plot(x,y,pch=16,log="xy")
plot(x,y,pch=16,log="y")
The untransformed data are in the top left-hand graph, and both x and y are transformed to logs before plotting in the upper right. The bottom left-hand plot shows both axes log-transformed, while the bottom right shows the data with only the y axis log-transformed. Note that all logs in R are to the base e by default (not base 10). It is important to understand that when R is asked to plot the log of zero it simply omits any such points without comment (compare the top left-hand graph with a point at (0, 0) with the other three graphs).
Get The R Book now with the O’Reilly learning platform.
O’Reilly members experience books, live events, courses curated by job role, and more from O’Reilly and nearly 200 top publishers.

