Graphs for Publication
The most likely changes you will be asked to make are to the orientation of the numbers on the tick marks, and to the sizes of the plotting symbols and text labels on the axes. There are four functions involved here:
| las | determines the orientation of the numbers on the tick marks; |
| cex | determines the size of plotting characters (pch); |
| cex.lab | determines the size of the text labels on the axes; |
| cex.axis | determines the size of the numbers on the tick marks. |
Here we show four different combinations of options. You should pick the settings that look best for your particular graph.
par(mfrow=c(2,2))
x<-seq(0,150,10)
y<-16+x*0.4+rnorm(length(x),0,6)
plot(x,y,pch=16,xlab="label for x axis",ylab="label for y axis")
plot(x,y,pch=16,xlab="label for x axis",ylab="label for y axis",
                    las=1,cex.lab=1.2, cex.axis=1.1)
plot(x,y,pch=16,xlab="label for x axis",ylab="label for y axis",
                    las=2,cex=1.5)
plot(x,y,pch=16,xlab="label for x axis",ylab="label for y axis",
                    las=3,cex=0.7,cex.lab=1.3, cex.axis=1.3)
The top left-hand graph uses all the default settings:
las = 0, cex = 1, cex.lab = 1
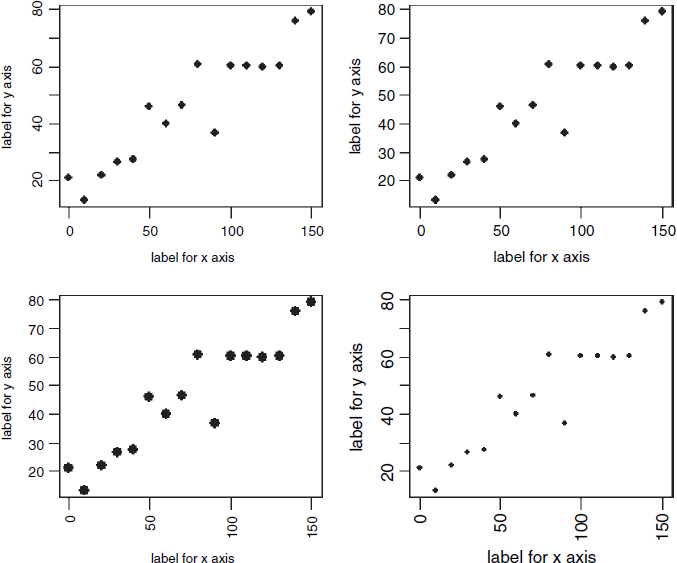
In the top right-hand graph the numbers have been rotated so that they are all vertical (las = 1), the label size has been increased by 20% and the numbers by 10%:
las = 1, cex = 1, cex.lab = 1.2, cex.axis=1.1
In the bottom left-hand graph the plotting symbol (pch = 16) has ...
Get The R Book now with the O’Reilly learning platform.
O’Reilly members experience books, live events, courses curated by job role, and more from O’Reilly and nearly 200 top publishers.

