Kaplan–Meier Survival Distributions
This is a discrete stepped survivorship curve that adds information as each death occurs. Suppose we had n = 5 individuals and that the times at death were 12, 17, 29, 35 and 42 weeks after the beginning of a trial. Survivorship is 1 at the outset, and stays at 1 until time 12, when it steps down to 4/5 = 0.8. It stays level until time 17, when it drops to 0.8 × 3/4 = 0.6. Then there is a long level period until time 29, when survivorship drops to 0.6 × 2/3 = 0.4, then drops at time 35 to 0.4 × 1/2 = 0.2, and finally to zero at time 42.
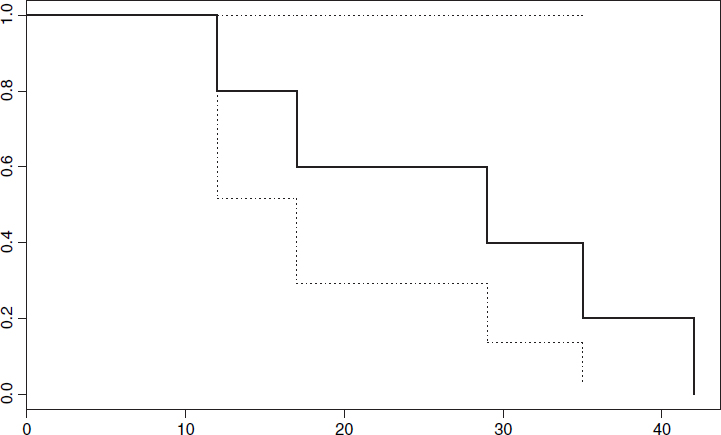
The solid line shows the survival distribution and the dotted lines show the confidence intervals (see below). In general, therefore, we have two groups at any one time: the number of deaths d(ti) and the number at risk r(ti) (i.e. those that have not yet died: the survivors). The Kaplan–Meier survivor function is

which, as we have seen, produces a step at every time at which one or more deaths occurs. Censored individuals that survive beyond the end of the study are shown by a + on the plot or after their age in a dataframe (thus 65 means died at time 65, but 65+ means still alive when last seen at age 65).
Get The R Book now with the O’Reilly learning platform.
O’Reilly members experience books, live events, courses curated by job role, and more from O’Reilly and nearly 200 top publishers.

