Geostatistical data
Mapped data commonly show the value of a continuous response variable (e.g. the concentration of a mineral ore) at different spatial locations. The fundamental problem with this kind of data is spatial pseudoreplication. Hot spots tend to generate lots of data, and these data tend to be rather similar because they come from essentially the same place. Cold spots are poorly represented and typically widely separated. Large areas between the cold spots have no data at all.
Spatial statistics takes account of this spatial autocorrelation in various ways. The fundament tool of spatial statistics is the variogram (or semivariogram). This measures how quickly spatial autocorrelation γ(h) falls off with increasing distance:
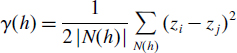
where N(h) is the set of all pairwise Euclidean distances i – j = h, |N(h)| is the number of distinct pairs within N(h), and zi and zj are values of the response variable at spatial locations i and j. There are two important rules of thumb: (1) the distance of reliability of the variogram is less than half the maximum distance over the entire field of data; and (2) you should only consider producing an empirical variogram when you have more than 30 data points on the map.
Plots of the empirical variogram against distance are characterized by some quaintly named features which give away its origin in geological prospecting:
- nugget, small-scale variation ...
Get The R Book now with the O’Reilly learning platform.
O’Reilly members experience books, live events, courses curated by job role, and more from O’Reilly and nearly 200 top publishers.

