Built-in Time Series Functions
The analysis is simpler, and the graphics are better labelled, if we convert the temperature data into a regular time series object using ts. We need to specify the first date (January 1987) as start=c(1987,1), and the number of data points per year as frequency=365.
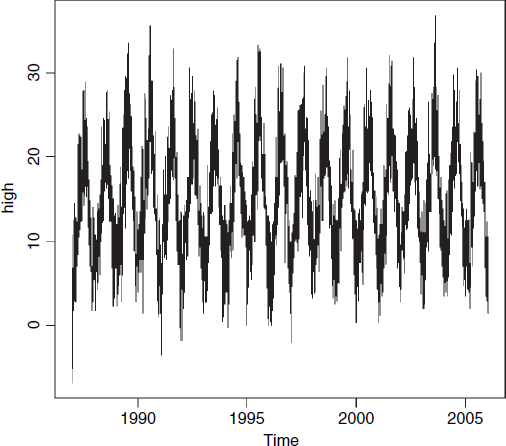
high<-ts(upper,start=c(1987,1),frequency=365)
Now use plot to see a plot of the time series, correctly labelled by years:
plot(high)
Get The R Book now with the O’Reilly learning platform.
O’Reilly members experience books, live events, courses curated by job role, and more from O’Reilly and nearly 200 top publishers.

