Background
The model is fitted using binary recursive partitioning, whereby the data are successively split along coordinate axes of the explanatory variables so that, at any node, the split which maximally distinguishes the response variable in the left and the right branches is selected. Splitting continues until nodes are pure or the data are too sparse (fewer than six cases, by default).
Each explanatory variable is assessed in turn, and the variable explaining the greatest amount of the deviance in y is selected. Deviance is calculated on the basis of a threshold in the explanatory variable; this threshold produces two mean values for the response (one mean above the threshold, the other below the threshold).
low<-(Industry<748)
tapply(Pollution,low,mean)

   FALSE     TRUE
67.00000 24.91667

plot(Industry,Pollution,pch=16)
abline(v=748,lty=2)
lines(c(0,748),c(24.92,24.92))
lines(c(748,max(Industry)),c(67,67))
The procedure works like this. For a given explanatory variable (say Industry, above):
- Select a threshold value of the explanatory variable (the vertical dotted line at Industry = 748).
- Calculate the mean value of the response variable above and below this threshold (the two horizontal solid lines).
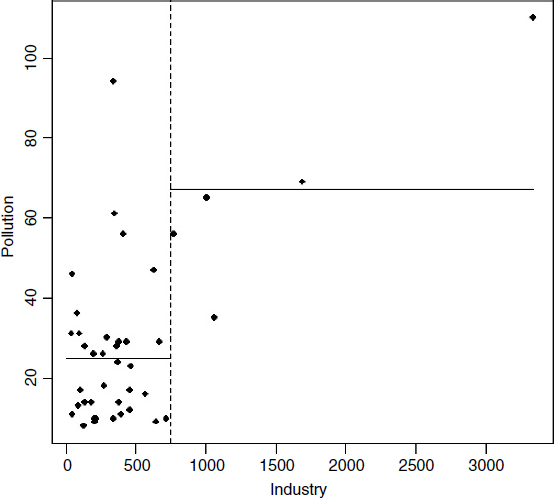
- Use the two means to calculate the deviance (as with SSE, see p. 451).
- Go through all possible values of the threshold (values on the x axis).
- Look to see which value of the threshold ...
Get The R Book now with the O’Reilly learning platform.
O’Reilly members experience books, live events, courses curated by job role, and more from O’Reilly and nearly 200 top publishers.

