Grouped Data for Non-linear Estimation
Here is a dataframe containing experimental results on reaction rates as a function of enzyme concentration for five different bacterial strains, with reaction rate measured just once for each strain at each of ten enzyme concentrations. The idea is to fit a family of five Michaelis–Menten functions with parameter values depending on the strain.
reaction<-read.table("c:\\temp\\reaction.txt",header=T)
attach(reaction)
names(reaction)

[1] "strain" "enzyme" "rate"

plot(enzyme,rate,pch=as.numeric(strain))
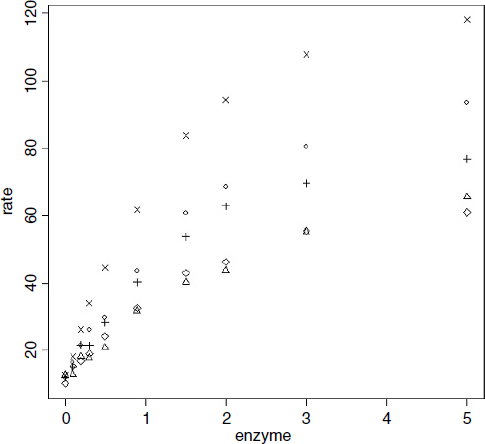
Clearly the different strains will require different parameter values, but there is a reasonable hope that the same functional form will describe the response of the reaction rate of each strain to enzyme concentration.
library(nlme)
The function we need is nlsList which fits the same functional form to a group of subjects (as indicated by the ‘given’ operator | ):
model<-nlsList(rate~c+a*enzyme/(1+b*enzyme)|strain,
                                 data=reaction,start=c(a=20,b=0.25,c=10))
Note the use of the groupedData style formula rate~enzyme | strain.
summary(model) Call: Model: rate ~ c + a * enzyme/(1 + b * enzyme) | strain Data: reaction Coefficients: a Estimate Std. Error t value Pr(>|t|) A 51.79746 4.093791 12.652686 1.943005e-06 B 26.05893 3.063474 8.506335 2.800344e-05 C 51.86774 5.086678 10.196781 7.842353e-05 D 94.46245 5.813975 16.247482 2.973297e-06 E 37.50984 ...Get The R Book now with the O’Reilly learning platform.
O’Reilly members experience books, live events, courses curated by job role, and more from O’Reilly and nearly 200 top publishers.

