An example with strongly humped data
The ethanol dataframe contains 88 sets of measurements for variables from an experiment in which ethanol was burned in a single cylinder automobile test engine. The response variable, NOx, is the concentration of nitric oxide (NO) and nitrogen dioxide (NO2) in engine exhaust, normalized by the work done by the engine, and the two continuous explanatory variables are C (the compression ratio of the engine), and E (the equivalence ratio at which the engine was run, which is a measure of the richness of the air–ethanol mix).
install.packages("SemiPar")
library(SemiPar)
data(ethanol)
attach(ethanol)
names(ethanol)

[1] "Nox" "C" "E"
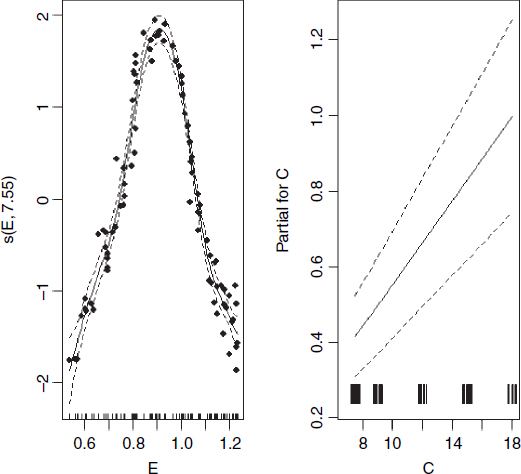
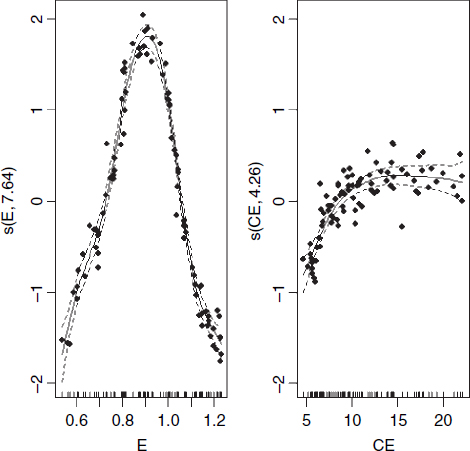
Because NOx is such a strongly humped function of the equivalence ratio, E, we start with a model, NOx ~ s(E) + C, that fits this as a smoothed term and estimates a parametric term for the compression ratio:
model<-gam(NOx~s(E)+C)
par(mfrow=c(1,2))
plot.gam(model,residuals=T,pch=16,all.terms=T)
The coplot function is helpful in showing where the effect of C on NOx was most marked:
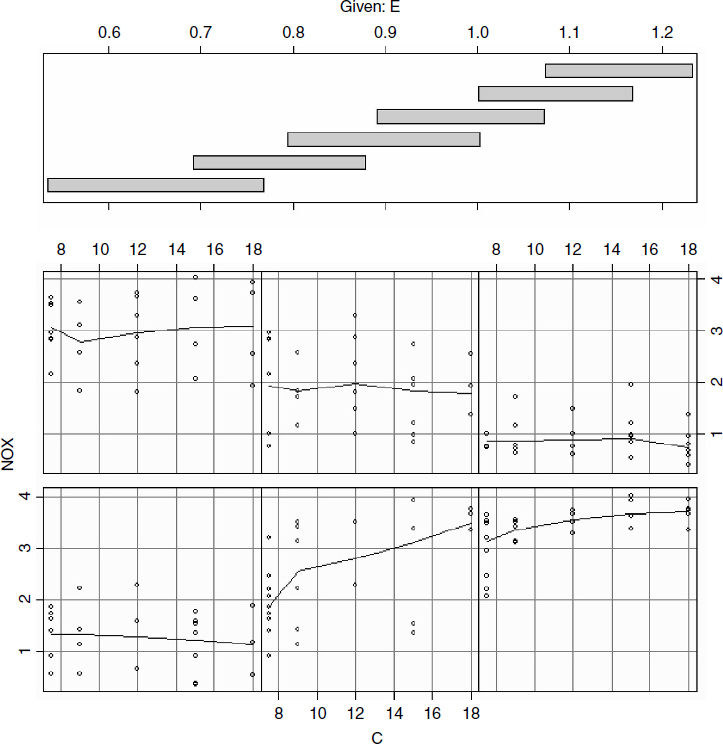
coplot(NOx~C|E,panel=panel.smooth)
There is a pronounced positive effect of C on NOx only in panel 2 (ethanol 0.7 < E < 0.9 from the shingles ...
Get The R Book now with the O’Reilly learning platform.
O’Reilly members experience books, live events, courses curated by job role, and more from O’Reilly and nearly 200 top publishers.

