Plot Methods for Contingency Tables
The departures from expectations of the observed frequencies in a contingency table can be regarded as (O − E)/![]() . The R function called assocplot produces a Cohen–Friendly association plot indicating deviations from independence of rows and columns in a two-dimensional contingency table.
. The R function called assocplot produces a Cohen–Friendly association plot indicating deviations from independence of rows and columns in a two-dimensional contingency table.
Here are data on hair colour and eye colour:
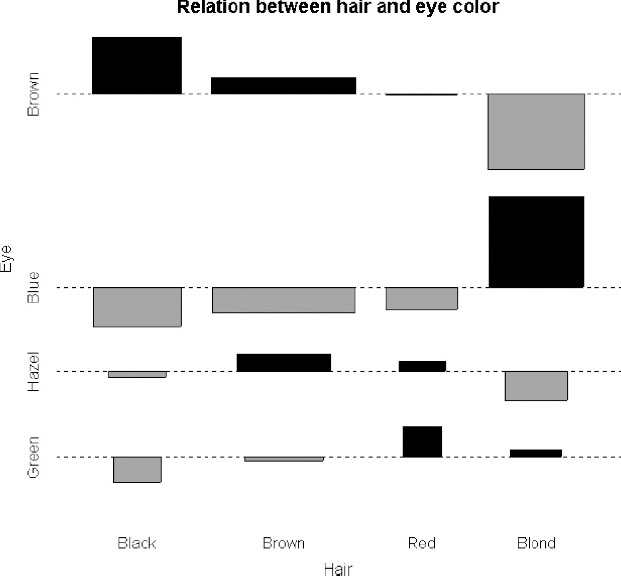
data(HairEyeColor)
(x <- margin.table(HairEyeColor, c(1, 2)) )

        Eye
 Hair   Brown   Blue   Hazel   Green
Black    68     20      15       5
Brown   119     84      54      29
Red      26     17      14      14
Blond     7     94      10      16

assocplot(x, main = "Relation between hair and eye color")
The plot shows the excess (black bars) of people with black hair that have brown eyes, the excess of people with blond hair that have blue eyes, and the excess of redheads that have green eyes. The red bars show categories where fewer people were observed than expected under the null hypothesis of independence of hair colour and eye colour.
Here are the same data plotted as a mosaic plot:
mosaicplot(HairEyeColor, shade = TRUE)
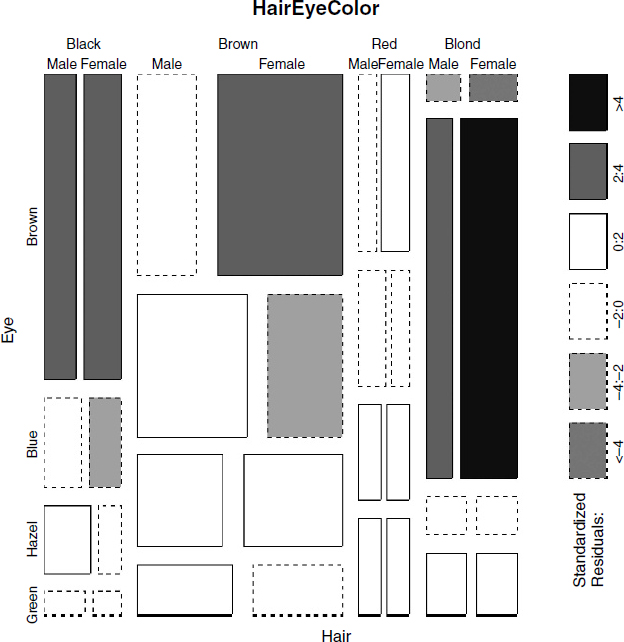
The plot indicates that there are significantly more blue-eyed blond females than expected in the case of independence, and too few brown-eyed blond females. Extended mosaic ...
Get The R Book now with the O’Reilly learning platform.
O’Reilly members experience books, live events, courses curated by job role, and more from O’Reilly and nearly 200 top publishers.

