Jackknife after Bootstrap
The jack.after.boot function calculates the jackknife influence values from a bootstrap output object, and plots the corresponding jackknife-after-bootstrap plot. We illustrate its use with the boot object calculated earlier called reg.model. We are interested in the slope, which is index=2:
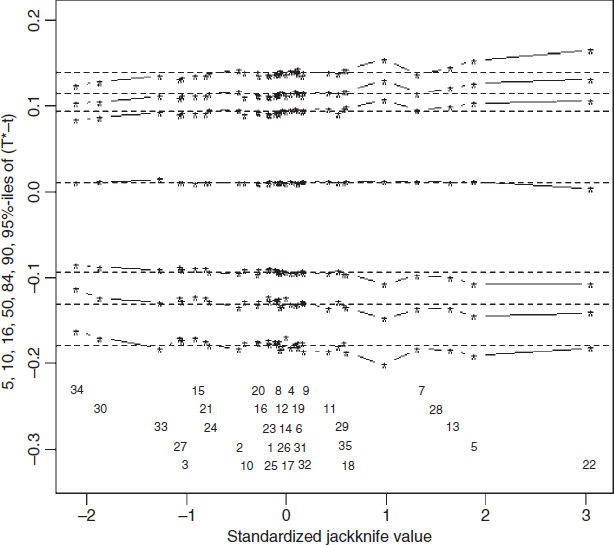
jack.after.boot(reg.model,index=2)
The centred jackknife quantiles for each observation are estimated from those bootstrap samples in which the particular observation did not appear. These are then plotted against the influence values. From the top downwards, the horizontal dotted lines show the 95th, 90th, 84th, 50th, 16th, 10th and 5th percentiles. The numbers at the bottom identify the 35 points by their index values within regdat. Again, the influence of point no. 22 shows up clearly (this time on the right-hand side), indicating that it has a strong positive influence on the slope.
Get The R Book now with the O’Reilly learning platform.
O’Reilly members experience books, live events, courses curated by job role, and more from O’Reilly and nearly 200 top publishers.

