Fitting a Mechanistic Model to Data
Rather than fitting some arbitrary model for curvature (as above, with a quadratic term for inputs), we sometimes have a mechanistic model relating the value of the response variable to the explanatory variable (e.g. a mathematical model of a physical process). In the following example we are interested in the decay of organic material in soil, and our mechanistic model is based on the assumption that the fraction of dry matter lost per year is a constant. This leads to a two-parameter model of exponential decay in which the amount of material remaining (y) is a function of time (t)
![]()
Here y0 is the initial dry mass (at time t = 0) and b is the decay rate (the parameter we want to estimate by linear regression). Taking logs of both sides, we get
![]()
Now you can see that we can estimate the parameter of interest, b, as the slope of a linear regression of log(y) on t (i.e. we log-transform the y axis but not the x axis) and the value of y0 as the antilog of the intercept. We begin by plotting our data:
data<-read.table("c:\\temp \\Decay.txt",header=T)
names(data)

[1] "time" "amount"

attach(data)
plot(time,amount,pch=16)
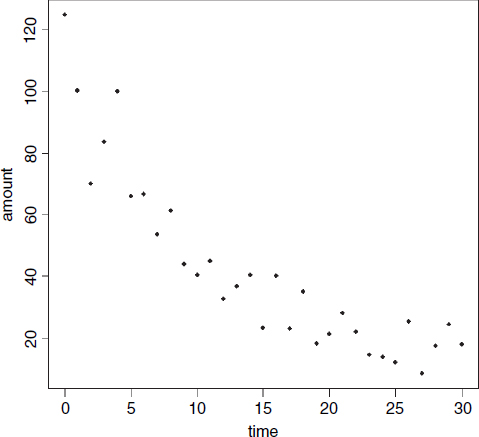
The curvature in the relationship ...
Get The R Book now with the O’Reilly learning platform.
O’Reilly members experience books, live events, courses curated by job role, and more from O’Reilly and nearly 200 top publishers.

