Error Bars
There is no function in the base package of R for drawing error bars on bar charts, although several contributed packages use the arrows function for this purpose (p. 147). Here is a simple, stripped down function that is supplied with three arguments: the heights of the bars (yv), the lengths (up and down) of the error bars (z) and the labels for the bars on the x axis (nn):
error.bars<-function(yv,z,nn){
xv<
barplot(yv,ylim=c(0,(max(yv)+max(z))),names=nn,ylab=deparse(substitute(yv)
))
g=(max(xv)-min(xv))/50
for(i in 1:length(xv)) {
lines(c(xv[i],xv[i]),c(yv[i]+z[i],yv[i]-z[i]))
lines(c(xv[i]-g,xv[i]+g),c(yv[i]+z[i], yv[i]+z[i]))
lines(c(xv[i]-g,xv[i]+g),c(yv[i]-z[i], yv[i]-z[i]))
}}
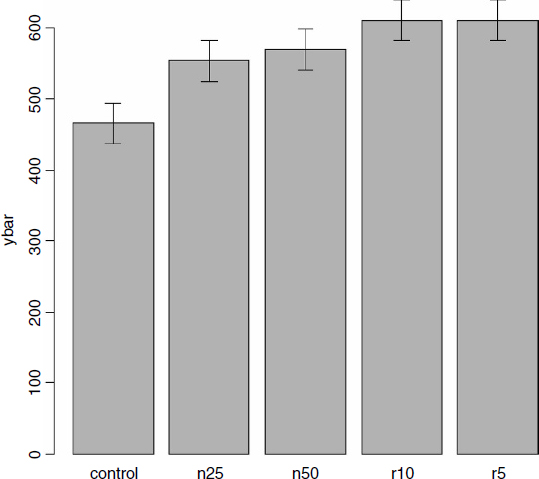
Here is the error.bars function in action with the plant competition data (p. 370):
comp<-read.table("c:\\temp\\competition.txt",header=T)
attach(comp)
names(comp)

[1] "biomass" "clipping"

se<-rep(28.75,5)
labels<-as.character(levels(clipping))
ybar<-as.vector(tapply(biomass,clipping,mean))
Now the invoke the function with the means, standard errors and bar labels:
error.bars(ybar,se,labels)
Here is a function to plot error bars on a scatterplot in both the x and y directions:
xy.error.bars<-function (x,y,xbar,ybar){ plot(x, y, pch=16, ylim=c(min(y-ybar),max(y+ybar)), xlim=c(min(x-xbar),max(x+xbar))) arrows(x, y-ybar, x, y+ybar, code=3, angle=90, length=0.1) arrows(x-xbar, y, x+xbar, ...Get The R Book now with the O’Reilly learning platform.
O’Reilly members experience books, live events, courses curated by job role, and more from O’Reilly and nearly 200 top publishers.

