4
Dataframes
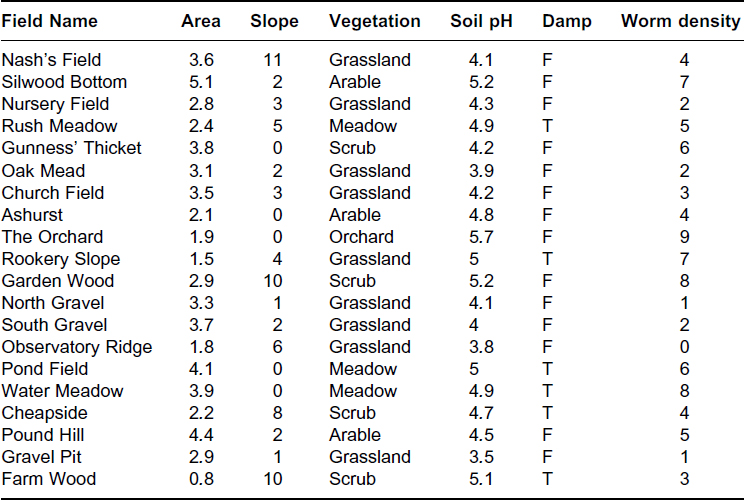
Learning how to handle your data, how to enter it into the computer, and how to read the data into R are amongst the most important topics you will need to master. R handles data in objects known as dataframes. A dataframe is an object with rows and columns (a bit like a matrix). The rows contain different observations from your study, or measurements from your experiment. The columns contain the values of different variables. The values in the body of a matrix can only be numbers; those in a dataframe can also be numbers, but they could also be text (e.g. the names of factor levels for categorical variables, like male or female in a variable called gender), they could be calendar dates (e.g. 23/5/04), or they could be logical variables (TRUE or FALSE). Here is a spreadsheet in the form of a dataframe with seven variables, the leftmost of which comprises the row names, and other variables are numeric (Area, Slope, Soil pH and Worm density), categorical (Field Name and Vegetation) or logical (Damp is either true = T or false = F).
Perhaps the most important thing about analysing your own data properly is getting your dataframe absolutely right. The expectation is that you will have used a spreadsheet such as Excel to enter and edit the data, and that you will have used plots to check for errors. The thing that takes some practice is learning exactly how to put your numbers ...
Get The R Book now with the O’Reilly learning platform.
O’Reilly members experience books, live events, courses curated by job role, and more from O’Reilly and nearly 200 top publishers.

