SHORTING A HIGH-FLYER
Whenever I document a trade, I include its source. I want to keep in mind how I found it—during a market scan, an email from a friend, and so on. One of my main sources for trading ideas is the SpikeTrade group. The idea to short ISRG came from Dave F., one of our most successful Spikers.
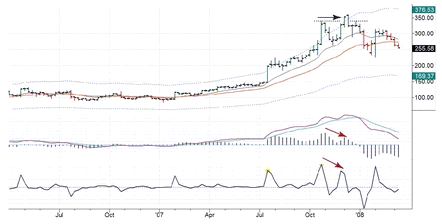
In planning a trade, I make my strategic decision on a long-term chart (usually weekly) and the tactical decision on a short-term chart (usually daily). This weekly chart of ISRG shows one great signal and two middling ones (
Figure 9.6). The great signal is a false upside breakout, marked with a blue arrow.
ISRG weekly with two moving averages and an Autoenvelope
MACD-Histogram and MACD Lines
Force Index—13-week EMA
When a stock breaks out to a new high, but cannot hold that level and sinks below the breakout line, it shows that the mass of traders has rejected the recent high—and prices are likely to swing in the opposite direction. This principle works in reverse at market bottoms—a false downside breakout tends to precede a rally.
Beginners love to trade in the direction of a breakout. The pros know that most breakouts fail. They are much more likely to fade them—trade against them.
While the false breakout was great, the two middling signals came from the weekly MACD-Histogram and the Force Index. Both trended lower, although neither ...


