BEARISH DIVERGENCES AT THE 2007 TOP
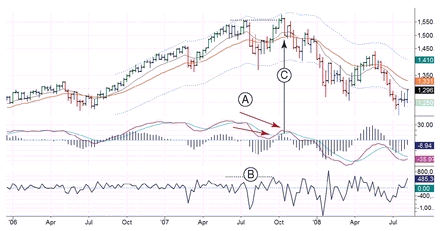
Let’s explore the messages of my favorite indicators at the 2007 stock market top. In July 2007 the market rallied to a peak (marked A on Figure 9.4). It then dropped sharply, sliced through the value zone and stabbed the lower channel line, entering the undervalued area. This was the deepest drop in more than a year, showing that bears were growing stronger. Notice how these indicators behaved as they traced out the bottom B.
Figure 9.4 S&P 2005-2008
161
S&P 500 weekly with two moving averages and an Autoenvelope
MACD-Histogram and MACD Lines
Force Index—13-week EMA
In August, MACD-Histogram fell lower than it did at the March 2007 low or any other low for the preceding year. The Force Index also fell lower in August 2007 than it did it March. These bearish signals confirmed one another—providing evidence that the bears were becoming stronger.
The stock market rallied again in October 2007 and reached a new historic high, but the key indicators topped out at much lower levels than in July, creating glaring bearish divergences. These occurred in MACD-Histogram as well as MACD Lines. The divergences of MACD Lines occur much more rarely than those of MACD-Histogram, but they provide even more powerful trading signals.
The only indicator that did not diverge at the October top was the Force Index. Two indicators were flashing major sell ...

Get The New Sell and Sell Short: How to Take Profits, Cut Losses, and Benefit from Price Declines, Expanded Second Edition now with the O’Reilly learning platform.

O’Reilly members experience books, live events, courses curated by job role, and more from O’Reilly and nearly 200 top publishers.