SELLING AT ENVELOPES OR CHANNELS
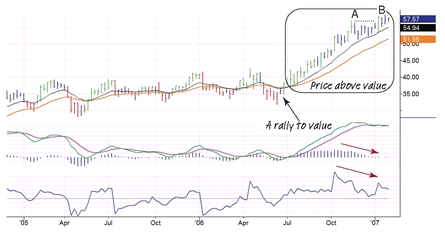
We have seen how moving averages on the weekly and daily charts serve as profit targets for the rallies that jump off the bear market lows. Later, after a bullish trend has been established, you will rarely see such targets. As prices keep chugging higher, moving averages start lagging behind them. This is why moving averages do not make good targets during steady uptrends.
Figure 4.9 INFY, weekly chart
033
This weekly chart of INFY shows a rally to value in 2006; that’s when a weekly moving average would have worked as a target. It was followed by a powerful upmove during which prices stayed above value for months. Clearly, a moving average would not have provided a target under these conditions. We need to find another tool for targeting exits during uptrends.
Before we continue our search for suitable targets, let us take a look at an important pattern on this weekly chart (see Figure 4.9). It shows one of the most powerful signals in technical analysis—a bearish divergence between prices and weekly MACD-Histogram. Following peak A, MACD-H declined below zero—I call this “breaking the back of the bull.” The stock rallied to a new bull market high at point B, but the indicator traced a much lower, almost non-existent peak. That was a loud warning to the bulls. This signal was confirmed by a multitude of other bearish signs—a breakout of prices ...

Get The New Sell and Sell Short: How to Take Profits, Cut Losses, and Benefit from Price Declines, Expanded Second Edition now with the O’Reilly learning platform.

O’Reilly members experience books, live events, courses curated by job role, and more from O’Reilly and nearly 200 top publishers.