Question 112—Trading Signals of the Force Index
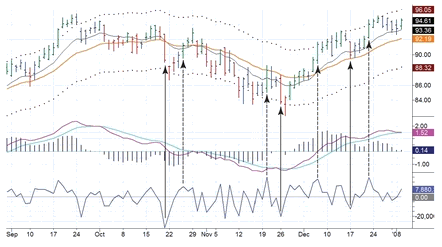
Figure 112
153
On the chart above, you can see that the downspikes of the Force Index (marked by solid arrows) tend to be followed by price bottoms the following day. The chart also shows that the upspikes of the Force Index (marked by dashed arrows) tend to be followed by the continuation of the uptrend rather than a top. These differences indicate that:
1. This indicator works only in downtrends.
2. This indicator works only in uptrends.
3. Uptrends and downtrends are not symmetrical and have to be traded differently.
4. One can base a trade on a single indicator in a bear market.

Get The New Sell and Sell Short: How to Take Profits, Cut Losses, and Benefit from Price Declines, Expanded Second Edition now with the O’Reilly learning platform.

O’Reilly members experience books, live events, courses curated by job role, and more from O’Reilly and nearly 200 top publishers.