Mapping the Power Base
To deepen your understanding of working with Power Bases and the implications this has on how you should spend your time, let’s dive into another example. Figure 5.2 shows an organization chart for the sales force of a medium-sized manufacturing company. This is the official structure, or distribution of authority. This chart tells you that the sales function is headed by a Vice President (VP) who has three Directors reporting to him: one each in the west, central, and east regions. Each of these Directors has a Sales Manager and a Support Manager reporting to him or her.
Figure 5.2: Sample Organization Chart (Distribution of Authority)
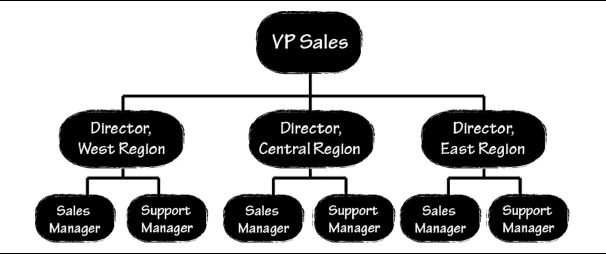
Along with background information on each of the players and some knowledge of perceived product needs, this chart would likely represent the sum total of Stage I and II sellers’ insight into the account. Stage IV Customer Advisors, however, recognize that there is much more insight to be gathered. Behind this official structure is a political one, a Power Base of influential individuals who revolve around a powerful Fox.
Suppose you have gained political insight by applying what you will learn in Chapter 6 on how to identify Foxes and Power Base members. As a result, you determine that the sales VP is the Business Unit Fox. Next, you establish who may be in the Fox’s Business Unit Power Base—and more important, how that ...
Get The New Power Base Selling: Master The Politics, Create Unexpected Value and Higher Margins, and Outsmart the Competition now with the O’Reilly learning platform.
O’Reilly members experience books, live events, courses curated by job role, and more from O’Reilly and nearly 200 top publishers.

